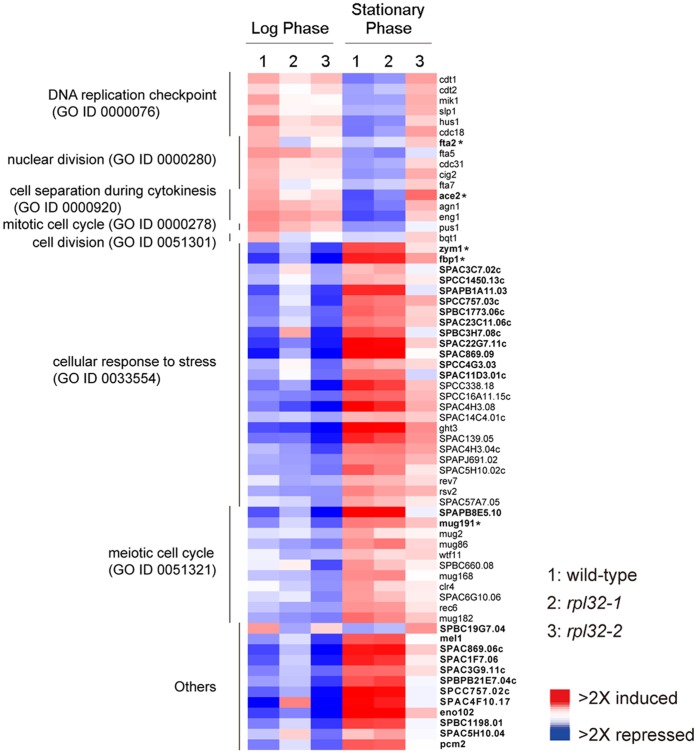
Figure 5. Transcriptomic patterns of WT, rpl32-1 or rpl32-2 cells respectively in log or stationary phase.
Color panel indicates relative increase (red), decrease (blue) and median (white) of transcription level for 64 genes regulated by Rpl32-1 and Rpl32-2 in a distinctive way (at least 2-fold changes). Bold type means genes are regulated oppositely by both Rpl32 paralogs (Fold change >2) and nonbold type means genes are regulated by either of Rpl32 paralogs (Fold change >2). * Changes in transcripts level were confirmed by QPCR.

