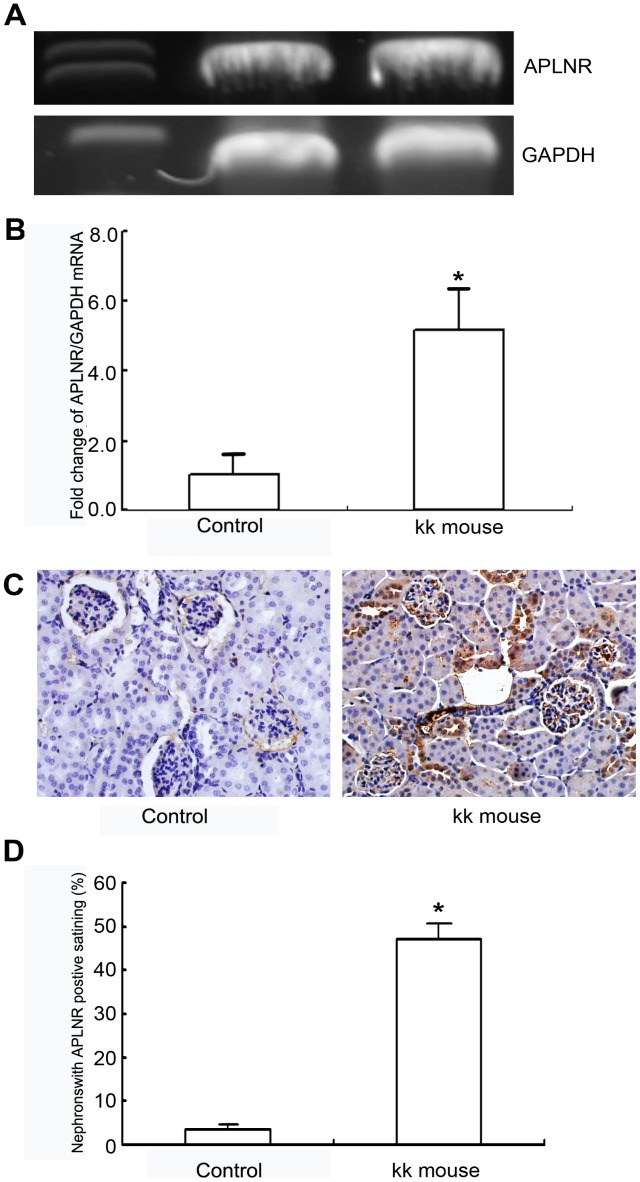
Figure 3. Apelin/APLNR expression in the mouse kidney.
A and B: APLNR mRNA was analyzed with real time-PCR. The relative amount of APLNR mRNA in the kidney of type 2 diabetic mice (KK mice) was significantly increased by 5.2-fold compared with that of control mice (C57BL/6). The data are expressed as the means±SD (n = 3, *p<0.01 vs. control group). C and D: The immunohistochemical assay of apelin expression in the kidney showed that the amount of glomeruli with apelin positive staining was significantly higher in type 2 diabetic mice (KK mice) compared to that in control mice (C57BL/6 mice). The bar in C indicates 10 µm. The data are expressed as the means±SD (n = 8, *p<0.01 vs. control group).

