
Figure 2.
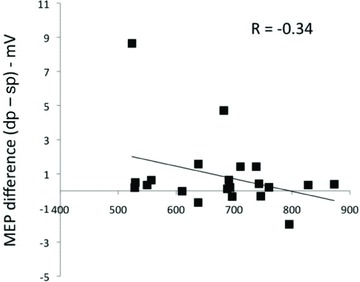
Scatter plot together with regression line illustrating, for all subjects, the linear relationship between median RT of right-hand behavioural responses and the difference in MEP amplitude between double-pulse and single-pulse TMS trials. The figure demonstrates a modest negative correlation (R=−.34) indicating that larger MEP difference scores (increased modulation by the conditioning TMS pulse) are associated with faster RT scores.