
Figure 4.
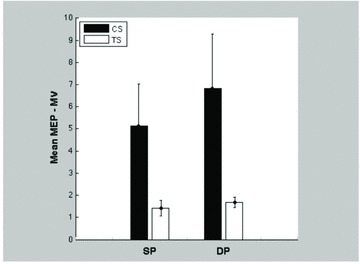
Mean MEP amplitude for each type of TMS trial (single pulse [sp] vs. double pulse [dp]) and for each group (Tourettes vs. controls). Error bars are standard error of the mean. The difference in MEP between groups is statistically significant for both types of TMS stimulation (p < .05).