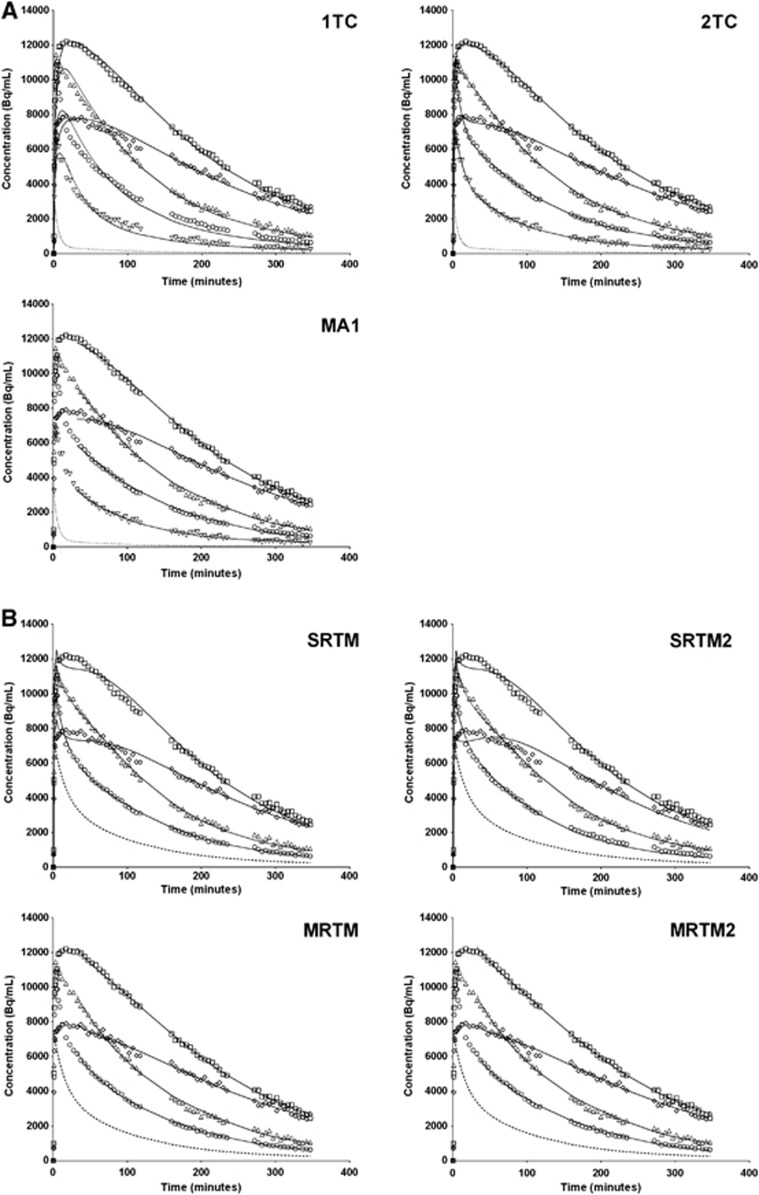
Figure 1.
Representative bolus time activity curves and fits from selected regions: anterior cingulate (□), thalamus (Δ), hippocampus (◊), cerebellum gray matter (○), and cerebellum white matter (∇). (A) One-tissue compartment model (1TC), two-tissue compartment model (2TC), and MA1 (t*=30) fits are shown as solid lines. Dotted line is the fitted metabolite-corrected arterial input. (B) SRTM, SRTM2, MRTM (t*=30), and MRTM2 (t*=30) fits are shown as solid lines. Dashed line is the cerebellum white matter input (sum of exponentials fit to cerebellum white matter data).

