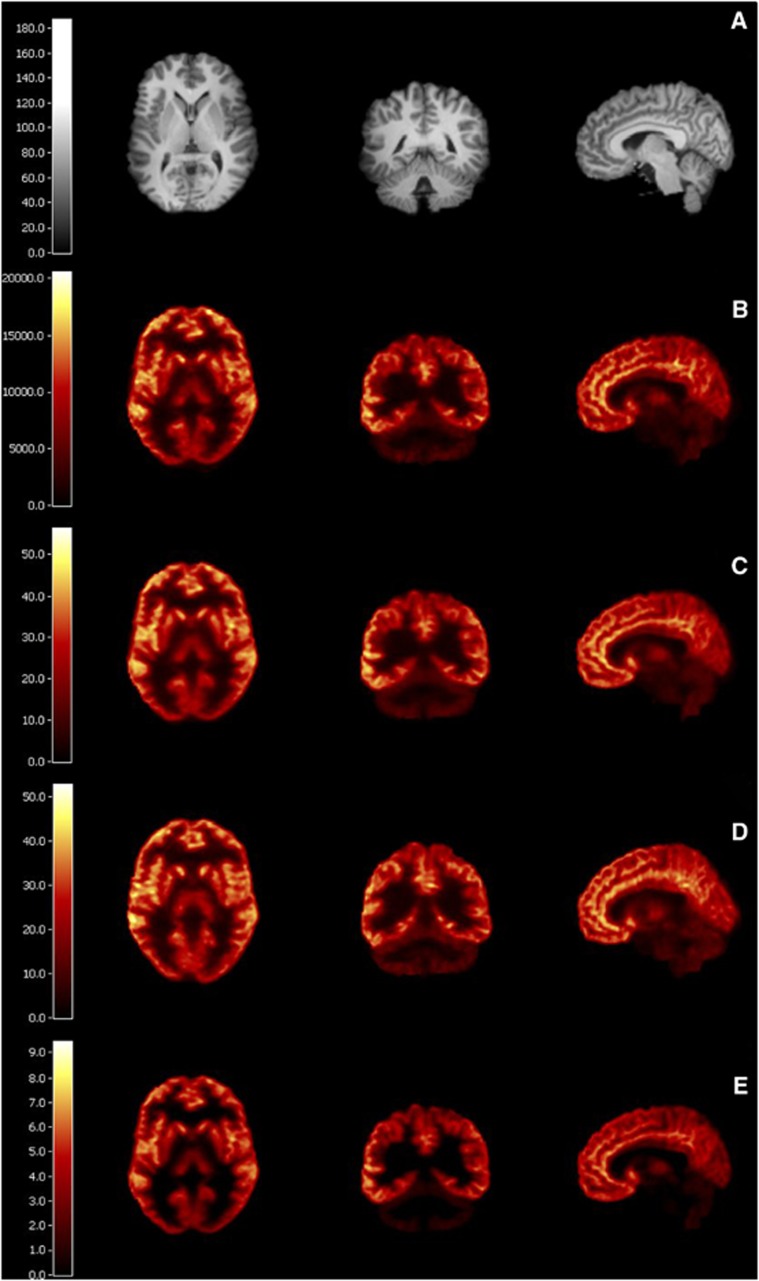
Figure 2.
(A) Anatomic magnetic resonance image (MRI). (B) Summed image (90–120 minutes) from bolus study; units are Bq/mL. (C) Parametric total volume of distribution (VT) image from bolus study estimated by MA1 (t*=30). (D) Parametric VT from bolus-plus-constant-infusion (B/I) study calculated by the equilibrium method (90–120 minutes). (E) Parametric binding potential (BPND) image from bolus study estimated by MRTM2 (t*=30). Three views are shown for all images: transaxial, coronal, and sagittal.

