Figure 5.
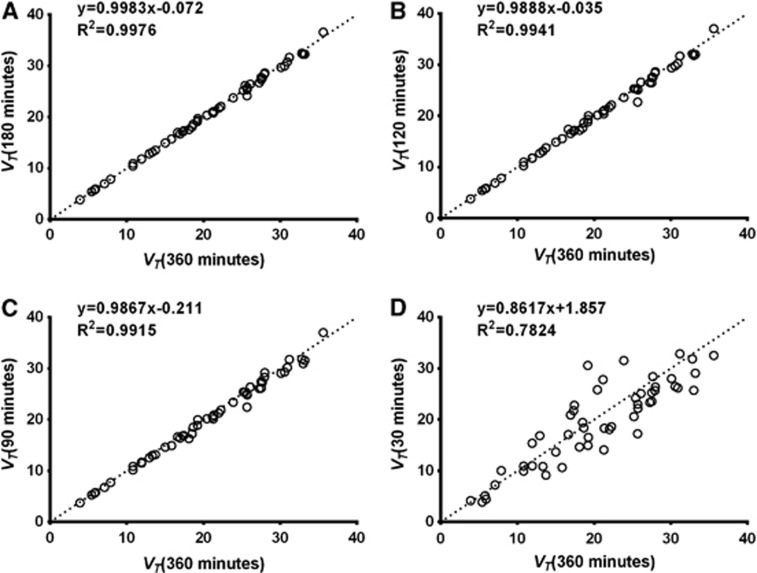
Effect of decreased scan duration on total volume of distribution (VT) estimated by the two-tissue compartment model (2TC) in bolus studies. Correlation between VT estimated from (A) 180, (B) 120, (C) 90, or (D) 30 minutes of data and 360 minutes of data (n=4 subjects). Dotted line in each graph is line of identity. Correlation between VT estimated from 60 minutes of data and 360 minutes of data is not shown but was similar to that for 90 minutes of data (VT60min=0.9824 × VT360min-0.4075, R2=0.9810).

