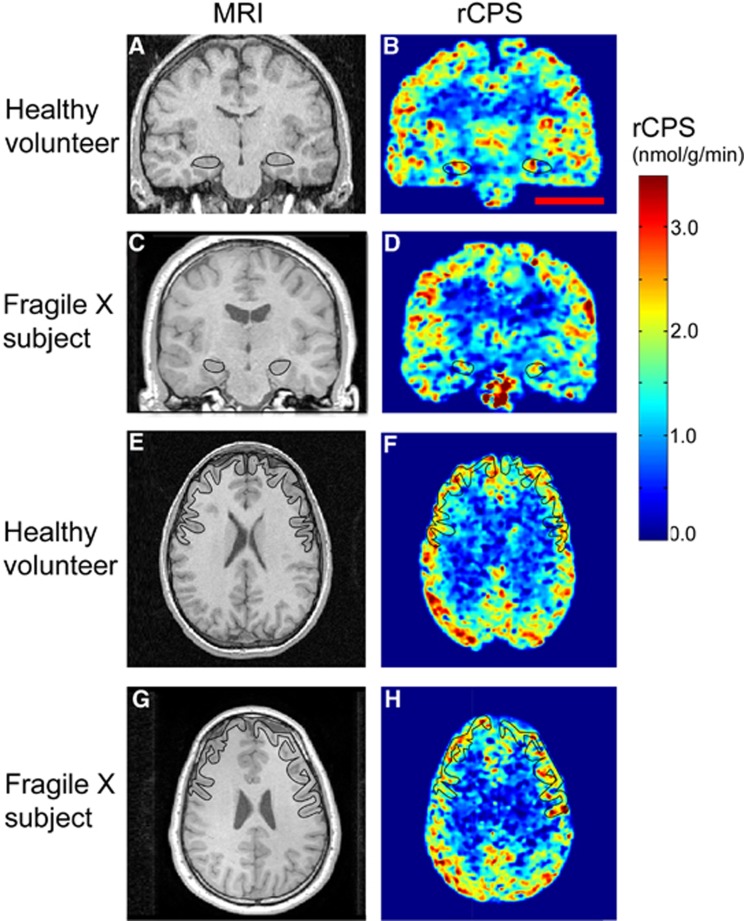
Figure 2.
Parametric images of rates of cerebral protein synthesis (rCPS) in a typical sedated healthy volunteer and sedated fragile X subject. Magnetic resonance images (MRIs) on the left correspond to rCPS positron emission tomography (PET) images on the right. All PET images were resliced to match the subject's MRI, and kinetic model parameters were estimated voxelwise by the Basis Function Method (BFM). Resultant parametric images were smoothed with a 3D Gaussian filter (kernel 2 mm full width at half maximum (FWHM)). Parametric images are color coded for rCPS according to the colorbar on the right. Images at the level of the hippocampus (A–D) are in the coronal plane, and the hippocampi are outlined in each image. Images at the level of the frontal cortex (E–H) are in the axial view and the frontal cortex is outlined in each image. Outlines were drawn on the MR images and transferred to resliced PET images. Scale bar in (B) represents 5 cm and pertains to all eight images.

