Figure 3.
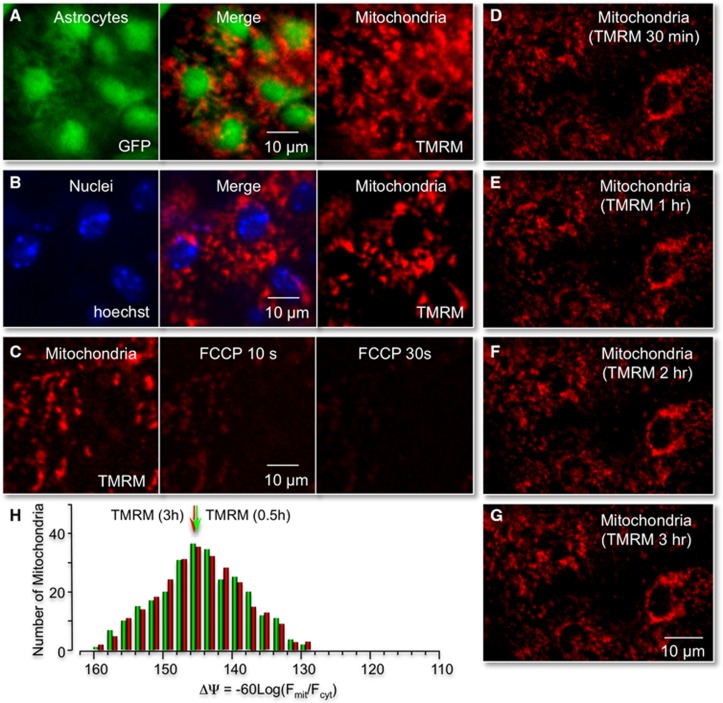
Identification of astrocyte mitochondria in vivo. (A) Cortical image of a transgenic mice expressing green fluorescent protein (GFP) in astrocytes (GFAP–GFP) and tail-vein injected with tetra-methyl rhodamine methyl ester (TMRM). (B) Same cortical region shown in (A), but imaged after tail-vein injection of the nuclear stain hoechst 33342. Note large, rounded soma of astrocytes (labeled green) colocalizes with nuclei (labeled blue). Individual mitochondria surrounding large-round nuclei were assigned to specific astrocytes. Images were obtained by maximal intensity Z projections of ∼40 μm cortical layer I. (C) Cortical application of the mitochondrial uncoupler FCCP (100 μM) significantly decreased TMRM fluorescence within 30 seconds, demonstrating functional TMRM labeling of polarized mitochondria. (D–G) Fluorescent labeling of cortical mitochondria with tail-vein injections of TMRM is stable for at least 3 hours. Maximal intensity image projections of Z stacks of mitochondria in layer one of the mouse cortex 30 minutes, 1, 2, and 3 hours after tail-vein injection of TMRM. (H) Histogram plot of the distribution of individual mitochondrial potentials (ΔΨ) 30 minutes and 3 hours post-TMRM injection.

