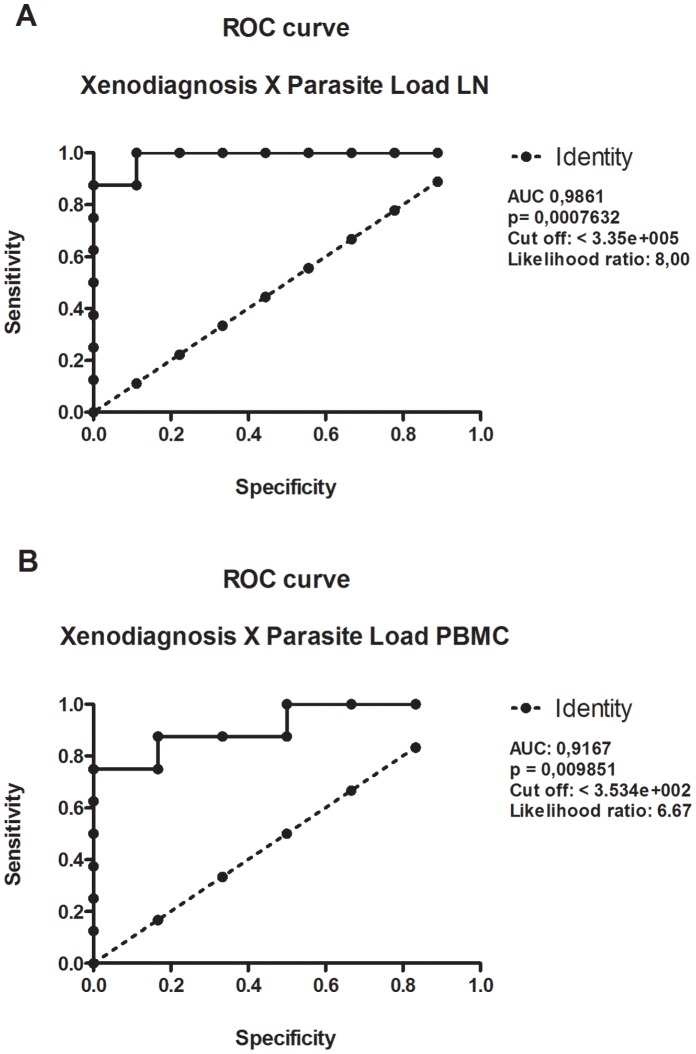
Figure 3. ROC curve of parasite load threshold levels predicting xenodiagnosis positivity.
A ROC curve was built using data regarding parasite load levels in lymph nodes (A) or PBMC (B) against the results of xenodiagnosis from 30 dogs infected with Leishmania infantum-chagasi plus five pairs of Lutzomyia longipalpis salivary glands, 450 days post infection.

