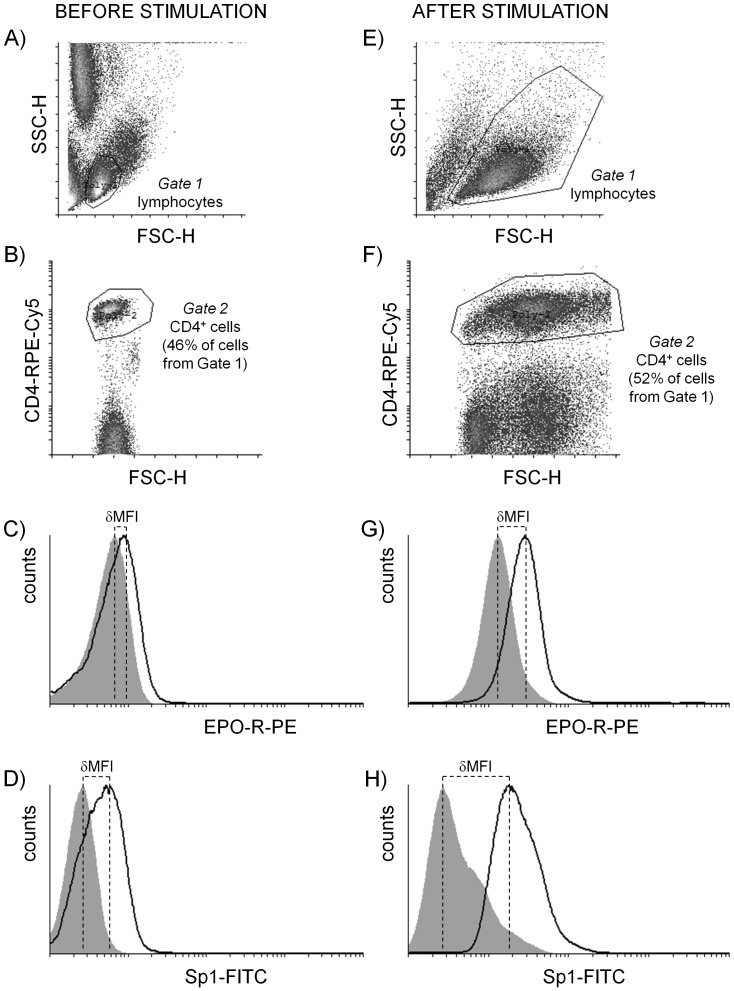
Figure 1. Fluorescence analysis of EPO-R and Sp1 expression measured by flow cytometry in CD4+ lymphocytes before and after stimulation with anti-CD3 antibody.
CD4+ cells were selected on the basis of forward and side scatter characteristics of lymphocytes, Gate 1 (A, E) and expression of CD4 antigen in gated lymphocytes, Gate 2 (B, F). Figures C and D present the expression of EPO-R and Sp1 in CD4+ cells (cells from Gate 1 and Gate 2) before stimulation, figures G and H present the expression of EPO-R and Sp1 in CD4+ cells stimulated with anti-CD3 antibody for 48 hours, respectively. For individual samples, expression of EPO-R and Sp1 was estimated as mean fluorescence shift (black line) toward isotype control (gray histogram): δMFI = MFI of the population of interest – MFI of the appropriate isotype control. Quantitative fluorescence analysis assessing the number of EPO-R molecules per cell based on δMFI was performed as previously described [3].

