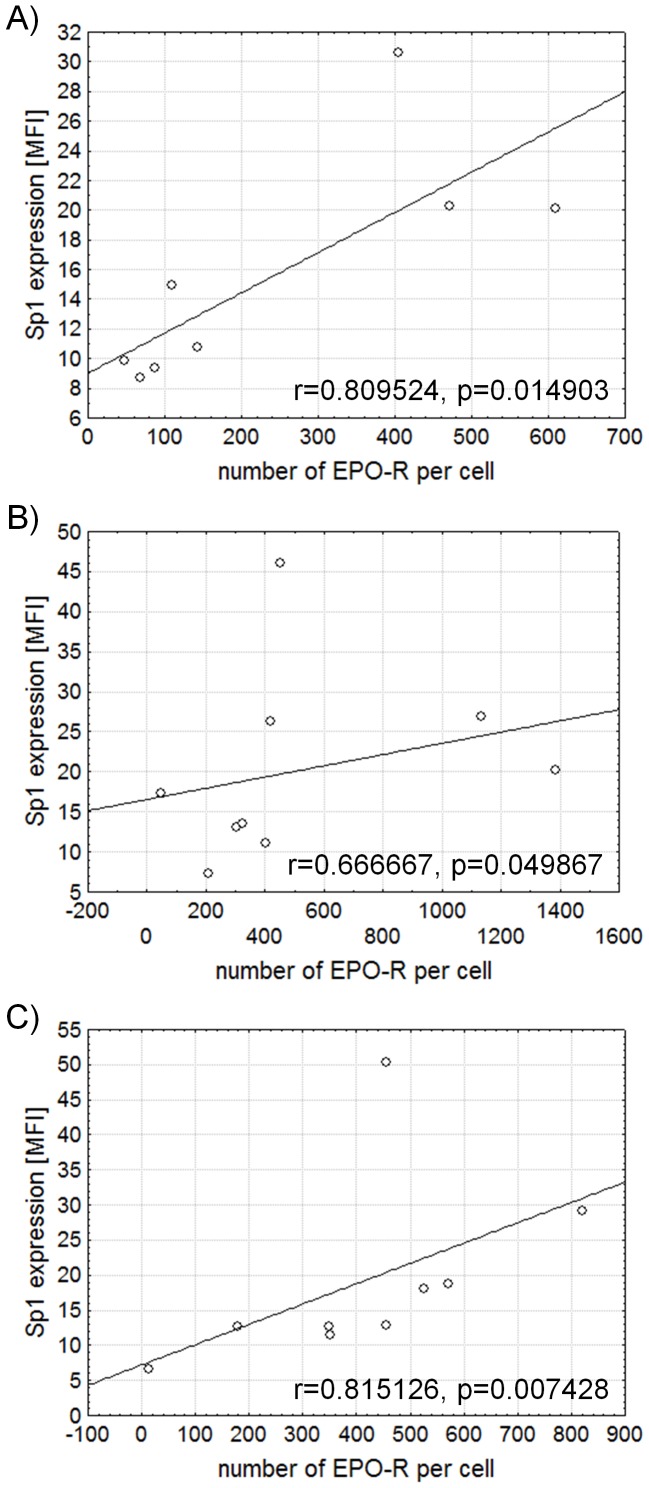
Figure 3. Correlations between expression of EPO-R and Sp1 measured by flow cytometry in CD4+ lymphocytes stimulated with anti-CD3 antibody.
Graphs present correlations between the number of EPO-R molecules per cell and the expression of Sp1 following 24 (A), 48 (B) and 72 (C) hours of stimulation with anti-CD3 antibody. Figures present Spearman R correlation, MFI – mean fluorescence intensity.

