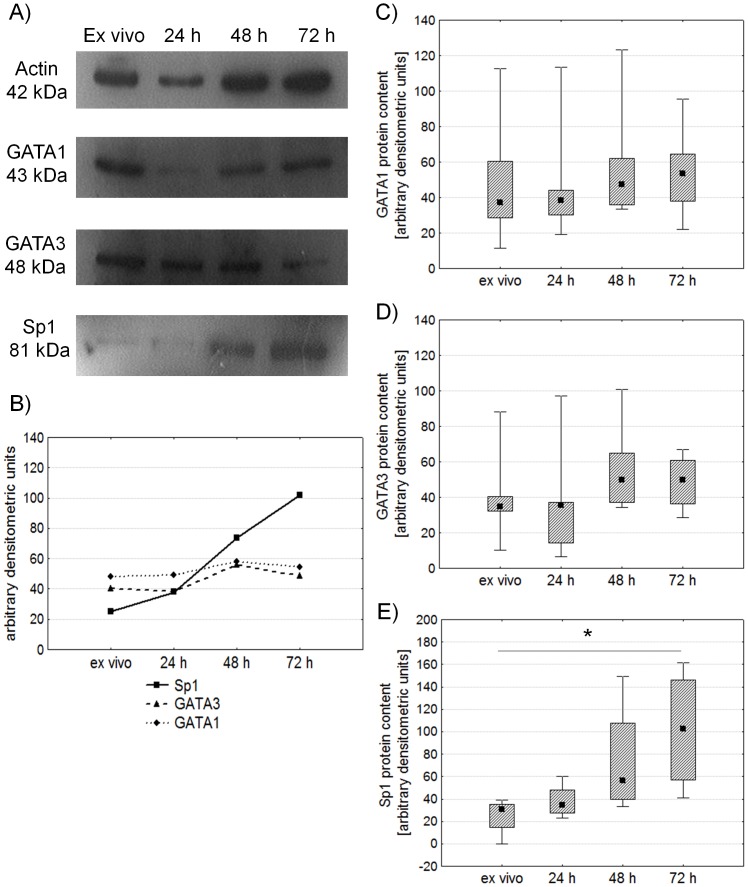
Figure 4. Comparison of GATA1, GATA3 and Sp1 expression determined by Western Blot in isolated CD4+ lymphocytes before and after stimulation with anti-CD3 antibody.
Figure A shows representative results. Figure B presents mean expression of GATA1, GATA3 and Sp1 in arbitrary densitometric units. Figures C, D and E present expression of GATA1, GATA3 and Sp1, respectively. Midpoints of figures present medians, boxes present the 25 and 75 percentile and whiskers outside visualize the minimum and maximum of all the data, *p<0.05, Friedman ANOVA and Post Hoc test.

