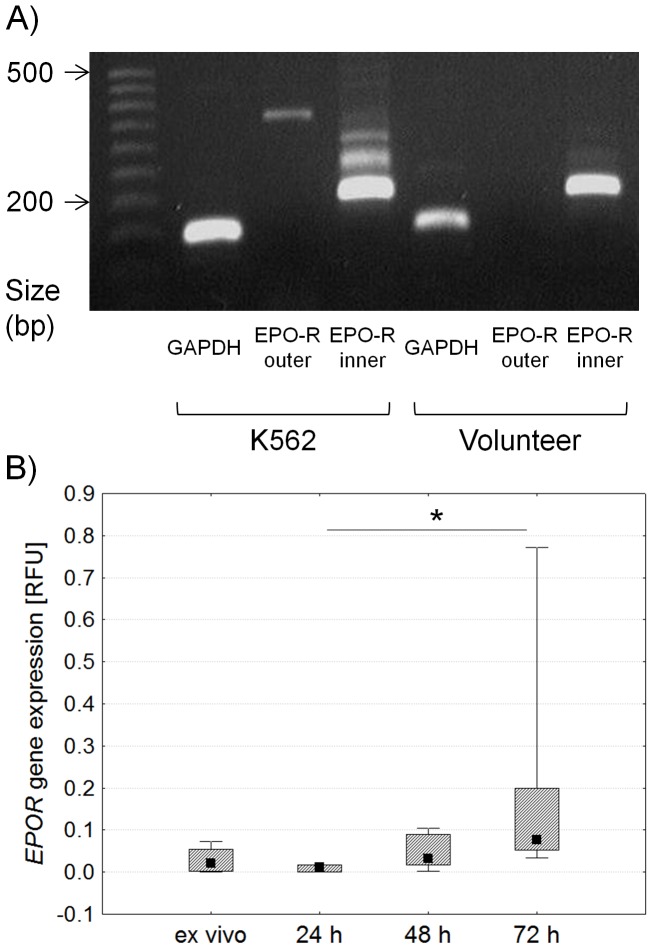
Figure 5. Estimation of EPOR gene expression by nested and real-time PCR in isolated CD4+ lymphocytes before and after stimulation with anti-CD3 antibody.
Figure A presents ex vivo expression of GAPDH reference gene after a single PCR run and expression of EPOR gene after two runs of PCR in K562 cell line (positive control) and a healthy volunteer; the remaining five PCR results were similar to the ones shown. Figure B shows a comparison of EPOR gene expression determined by real-time PCR in isolated CD4+ lymphocytes before and after stimulation with anti-CD3 antibody. Midpoints in the figures present medians, boxes present the 25 and 75 percentile and whiskers outside visualize the minimum and maximum of all the data, *p<0.05, Friedman ANOVA and Post Hoc test, RFU – relative fluorescence units.

