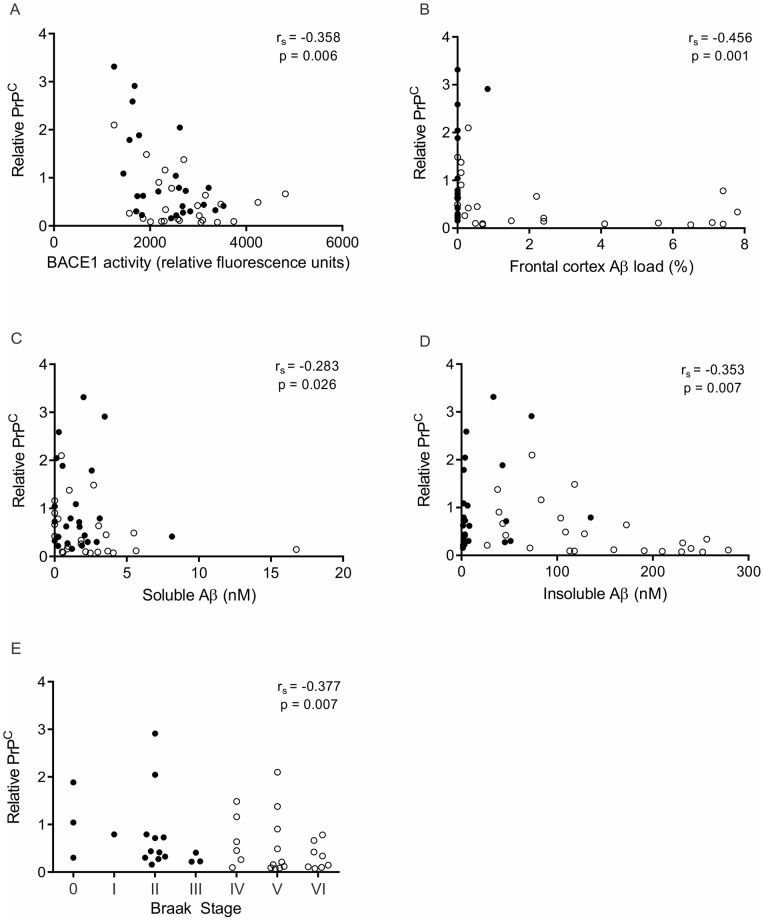
Figure 2. PrPC inversely correlates with BACE1 activity, Aβ load, soluble and insoluble Aβ and Braak stage.
Relative PrPC protein levels were plotted against BACE1 activity (A), Aβ load (B), soluble Aβ (C), insoluble Aβ (D) and Braak stage (E) for each subject in the cohort (n = 48. Control, filled circles; AD, empty circles). PrPC significantly inversely correlates with BACE1 activity, Aβ load, soluble Aβ, insoluble Aβ and Braak stage as determined by Spearman's rank correlation coefficient (rs).

