
Figure 4. PrPC is not reduced in DS brains.
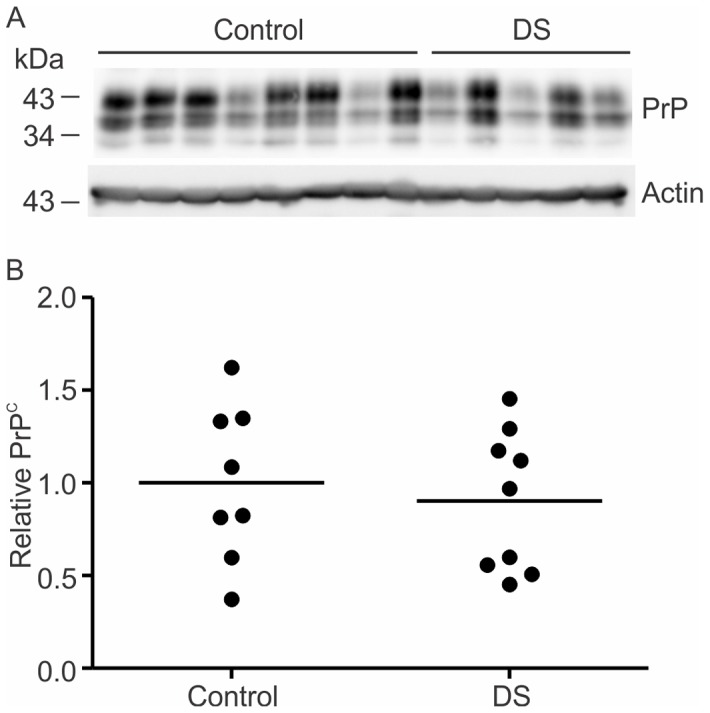
Representative immunoblots of PrPC and actin in temporal cortex samples from Down's syndrome patients compared to age-matched controls (A). Densitometric analysis of PrPC relative to actin levels is represented in grouped scatter plot (B). Line represents mean, *p<0.05, n = 8 control group and n = 9 DS group.