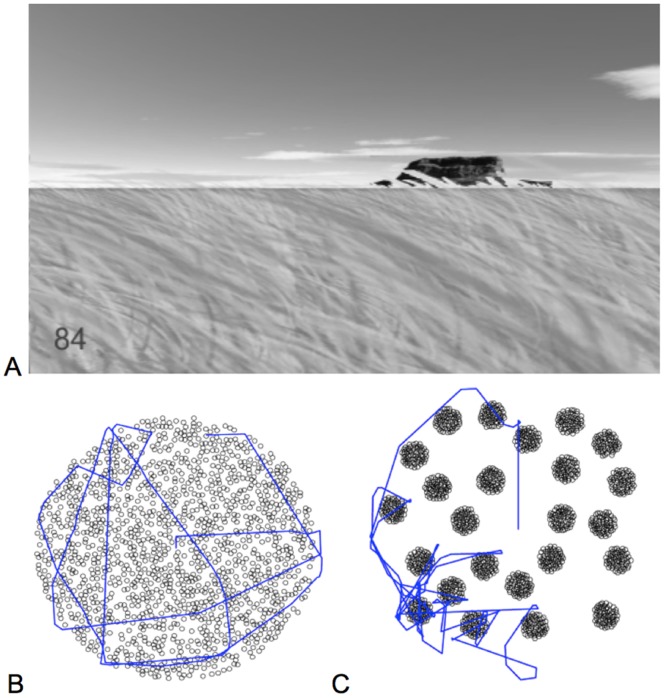
Figure 1. The virtual foraging environment, resource distributions, and representative paths.
A. Participants’ perspective during the task. One of the global landmarks (a mountain) is visible in the distance. The number in the lower left hand corner is the number of resources collected so far. B. The resource distribution in the dispersed environment with a path generated by one participant. C. The resource distribution in the patchy environment with a path generated by one participant.

