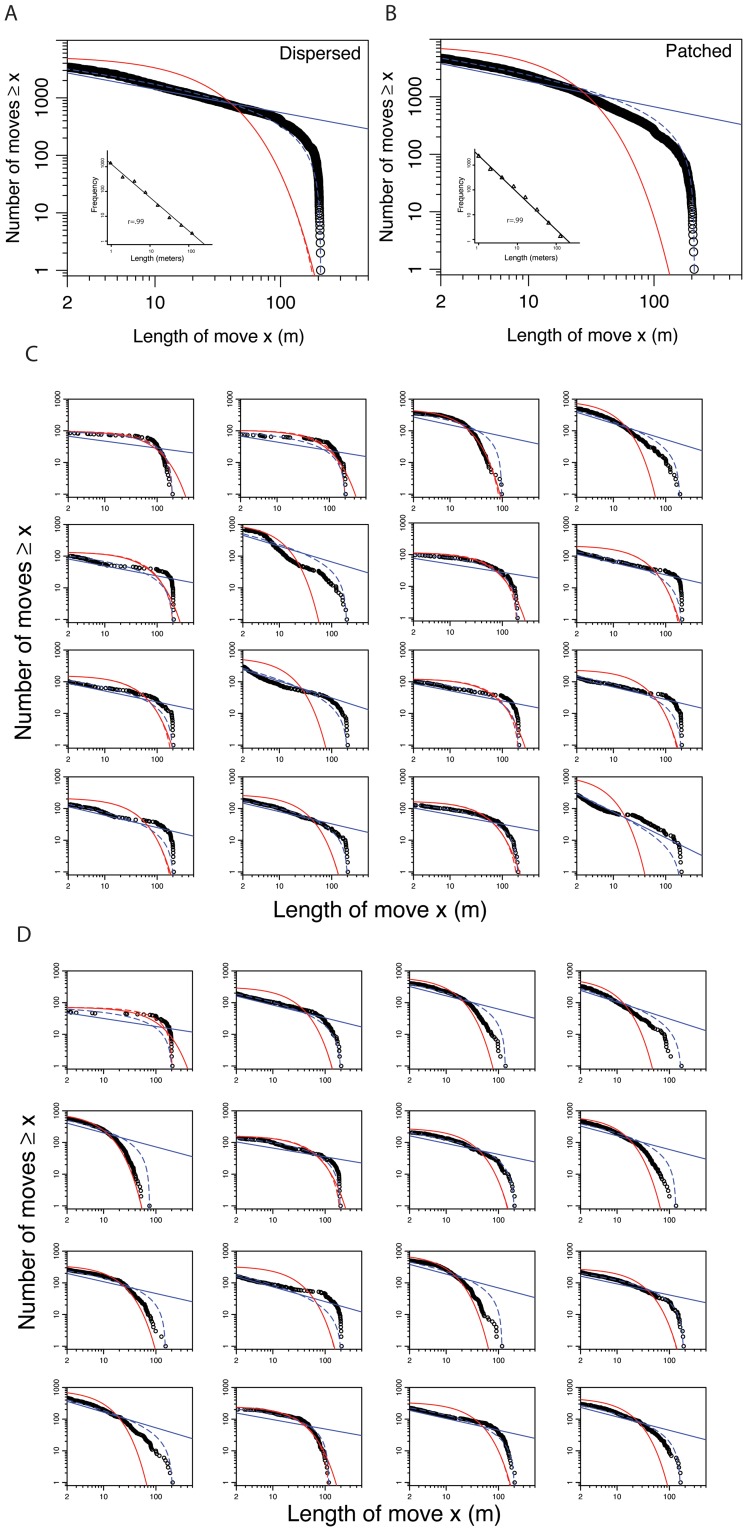
Figure 2. Rank/frequency plots of aggregated and individual data along with model fits on logarithmic axes.
Black circles are movement lengths ≥ x. The four model fits are power-law (blue-straight line), bounded power-law (curved blue-dashed line), unbounded exponential (curved red line), and bounded exponential (curved red-dashed line). A. The aggregated data for the dispersed condition. The inset shows the results of logarithmic binning with best fitting power-law. B. The aggregated data for the patched condition. The inset shows the results of logarithmic binning with best fitting power-law. C. Data for each individual in the dispersed condition. D. Data for each individual in the patched condition.

