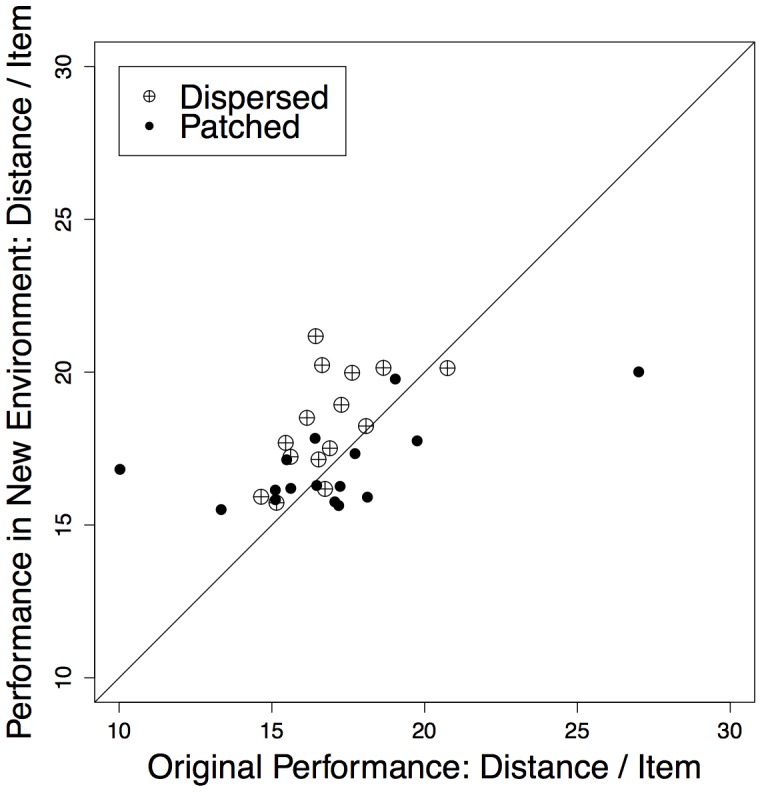
Figure 4. Comparing path performance across environments.

We compared path performance by randomly simulating paths from the alternative environment using 100 simulated versions of each observed path in the alternative resource distribution. Paths from the patched condition simulated in the dispersed environment performed as well as dispersed paths in the dispersed environment (t(15) = 0.05, P = .97, two-tailed t-test). However, paths from the dispersed environment simulated in the patchy environment were outperformed by the original paths from the patchy environment (t(14) = −3.91, P = .002, two-tailed t-test).
