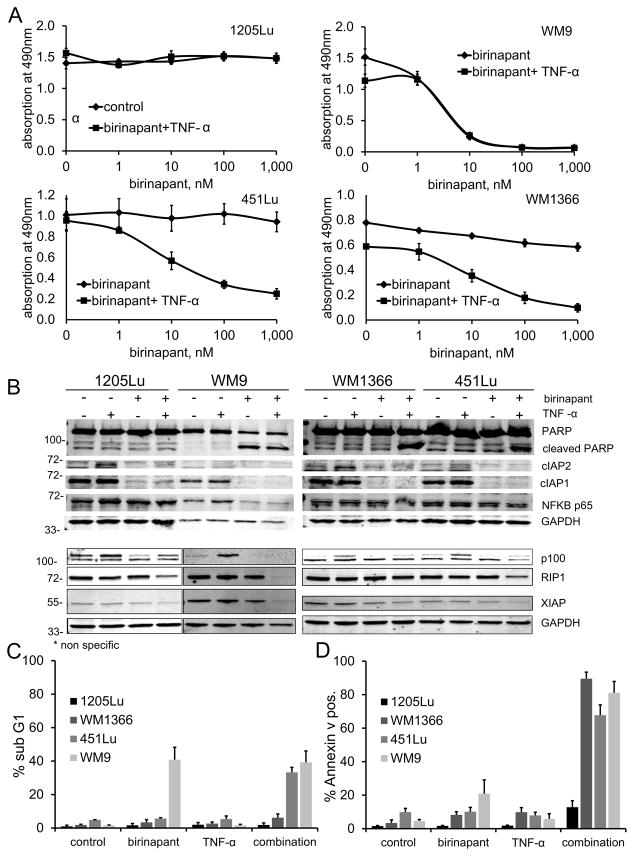
Figure 2. Effect of birinapant alone or in combination with TNF-α.
Four cell lines showing varying responses to birinapant as seen in the whole panel of cell lines assessed: combination resistant (1205Lu), single agent sensitive (WM9), and combination sensitive (451Lu and WM1366). A, dose response curves after 72h incubation with birinapant (TL32711) at indicated doses alone or in combination with TNF-α 1ng/ml using the MTS assay. For the cell lines 451Lu and WM1366: p<0.05 for doses ≥10nM. Data are represented as mean of three or more experiments ± standard error of mean (SEM). B, immunoblots showing the same four cell lines after 24h incubation with birinapant 1uM, TNF-α 1ng/ml, or the combination of both, compared to untreated controls. Levels of target IAP proteins, cleaved PARP, NF-κB p65, NF-κB2 p100- p52, and RIP1 were assessed. GAPDH was included to ensure equal loading. C, relative number of cells in the sub G1 fraction as assessed by propidium iodide cell cycle analysis after 24h incubation with birinapant 1uM, TNF-α 1ng/ml or combination of both. Data are represented as mean ± SEM (n=3 biological replicates). D, relative number of annexin V positive cells as assessed by flow cytometry after 24h incubation with birinapant 1uM, TNF-α 1ng/ml or combination of both. Data are represented as mean ± SEM (n=3 biological replicates).

