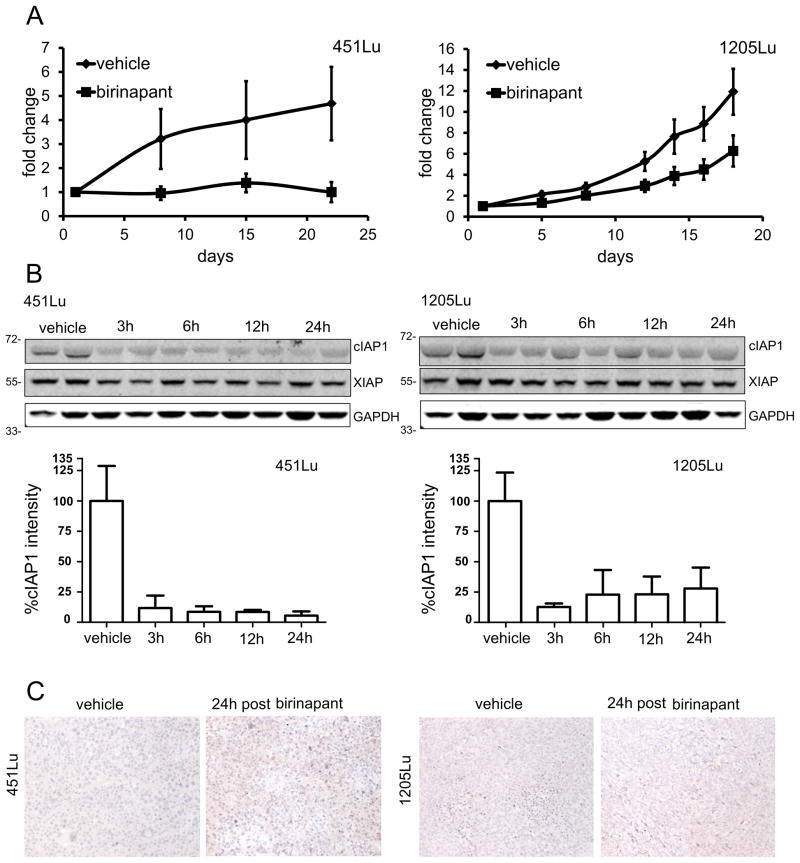
Figure 5. Effect of birinapant in vivo.
A, NUDE mice bearing 451Lu (left panel) or 1205Lu (right panel) xenografts were dosed three times per week intra-peritoneal with either birinapant at 30mg/kg or vehicle control. Dosing was started after formation of palpable tumors. The graphs show duration of treatment in days on the x-axes and fold change in tumor volume compared to first day of dosing on the y-axes. In the 451Lu xenografts, two animals of the birinapant group had un-measureable tumors at the end of study. Data represents mean ±SEM (n=5/ group), p<0.05 at end of treatment. B, NUDE mice bearing 451Lu or 1205Lu xenotransplants with a mean tumor volume of approximately 200mm3 were dosed twice at a 48h interval with either birinapant at 30mg/kg or vehicle control. At four time points (3h, 6h, 12h, and 24h) after last dosing tumors were harvested. Immunoblots of tumor protein lysates harvested at indicated time points are shown. Blots were probed for levels of cIAP1, XIAP, and cIAP2 (not measurable). GAPDH was included to insure equal loading. Quantifications of cIAP1 bands are included as bar graphs. Data represents mean +SEM. C, tumor tissues of control and birinapant treated animals were stained for activated caspase-3.

