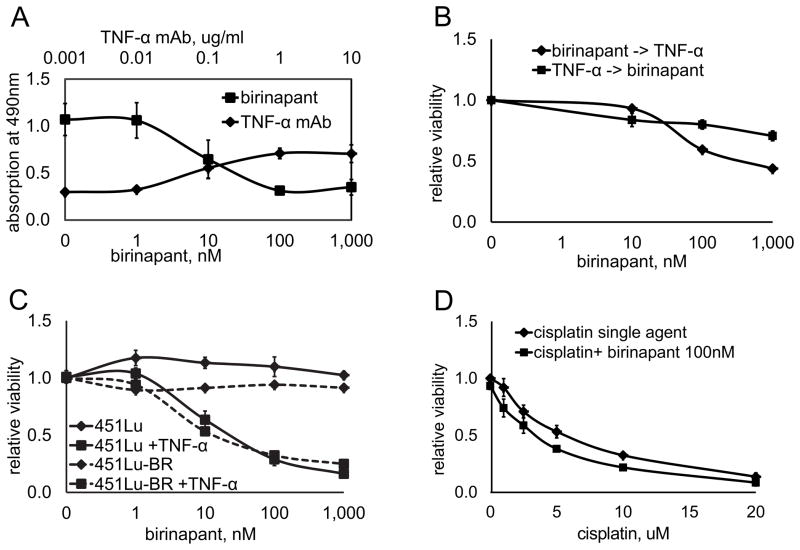
Figure 6. The role of TNF-α in the effectiveness of birinapant in vitro.
A, TNF-α is required for in vitro growth inhibition: The melanoma cell line WM9 was treated with birinapant at doses indicated on the lower x-axis for 72h. The same cell line was treated with birinapant at a fixed dose of 1uM in combination with a monoclonal blocking antibody binding to TNF-α (TNF-α mAb) at increasing doses as indicated on the upper x-axis. Viability was assessed after 72h via the MTS assay; absolute values are shown on the Y-axis. Data represents mean of three experiments ±SEM. B, combination activity between birinapant and TNF-α is schedule dependent: 451Lu cells were incubated either with birinapant at indicated doses for 36h and subsequently TNF-α 1ng/ml for 36h (birinapant -> TNF-α), with TNF-α 1ng/ml for 36h and subsequently birinapant at indicated doses (TNF-α-> birinapant), or the combination of both for the full 72h. Cell viability was assessed relative to untreated controls. Data represents mean of three experiments ±SEM. C, Effect of the combination therapy on a BRAF inhibitor resistant cell line. A cell line with acquired resistance to BRAF inhibition (451Lu-BR) shows the identical response to birinapant as its parental cell line (451Lu). Cells were treated with birinapant at indicated doses either alone (451Lu, 451Lu-BR) or in combination with TNF-α 1ng/ml (451Lu + TNF-α, 451Lu-BR + TNF-α) for 72h. Cell viability is shown relative to untreated controls. Data represents mean of three experiments ±SEM. D, Effect of cisplatin on melanoma viability in the absence or presence of birinapant. The birinapant resistant cell lines 451Lu and WM1366 were treated with cisplatin in increasing doses up to 20uM as a single agent or in combination with birinapant at a fixed dose of 100nM. Cell viability is shown relative to untreated controls. Data represents mean of both cell lines ±SEM.

