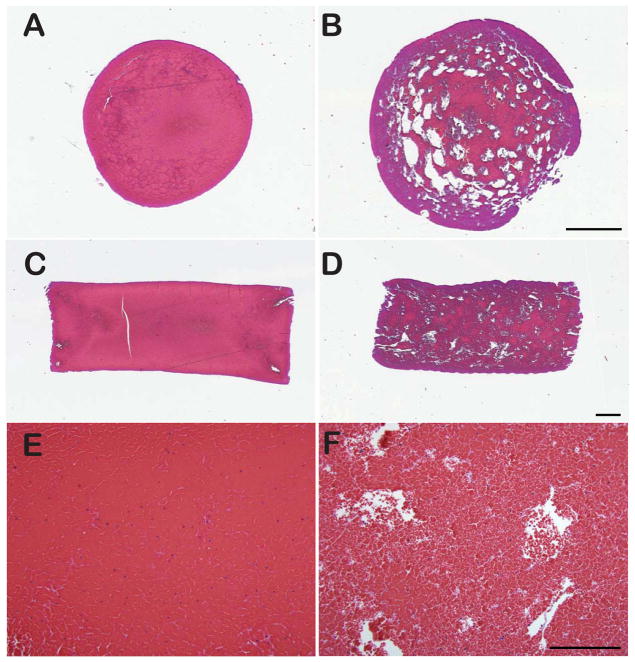
Figure 5.
Representative images of retracted (left column) and unretracted thrombi (right column) showing a cross-section (A, B), a longitudinal section (C, D) and high power 20x magnification. Stain: H&E. Bar = 1 mm in A–D, 200 μm in E–F. At 20X magnification, unretracted thrombi (B) appear much more porous than retracted thrombi (E), as evidenced by the extent of space devoid of erythrocytes and fibrin. Image analysis of these images revealed that retracted thrombi contained 0.87 ± 0.95% of this space compared to 3.45 ± 2.17% within unretracted thrombi.

