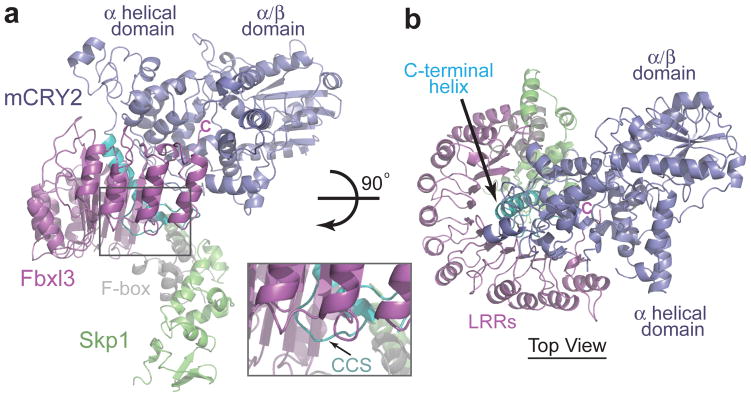
Figure 3. Overall structure of the mCRY2-Fbxl3-Skp1 complex.

a, Ribbon diagrams of the complex containing mCRY2 (blue), Fbxl3 (magenta), and Skp1 (green). Letter C indicates the carboxyl terminus of Fbxl3. The C-terminal helix and the CCS region in mCRY2 are colored in cyan and the F-box domain of Fbxl3 in grey. The inset figure shows a close-up view of the mCRY2 CCS region. b, Orthogonal view of the mCRY2-Fbxl3-Skp1 complex as shown in Fig. 3a.
