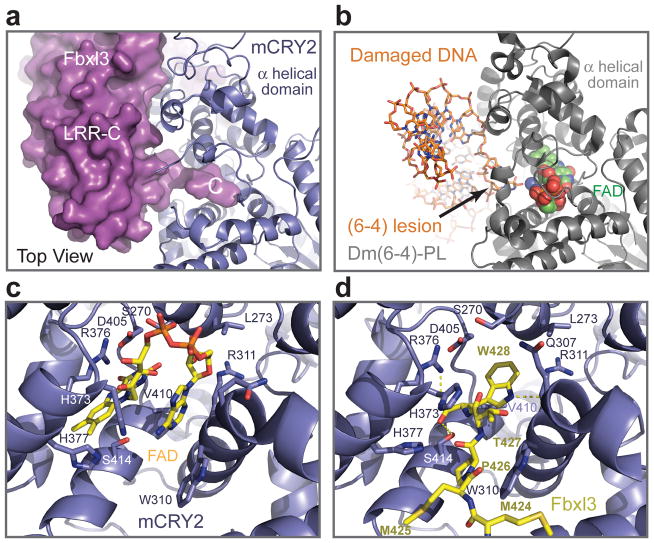
Figure 5. Interaction between the Fbxl3 C-terminal tail and the mCRY2 FAD-binding pocket.
a, Surface representation of the Fbxl3 LRR-C subdomain with its C-terminal tail inserted into the FAD-binding pocket of mCRY2 in blue ribbon diagrams. b, The structure of Drosophila (6-4)-photolyase-DNA complex shown from the same orientation as mCRY2 is displayed in Fig. 5a. FAD is shown in spheres. The damaged DNA substrate is shown in sticks. c, d, A close-up view of the mCRY2 FAD-binding pocket showing key FAD- and Fbxl3-interacting residues. FAD and the Fbxl3 tail are shown in sticks. Yellow dash lines represent hydrogen bonds.

