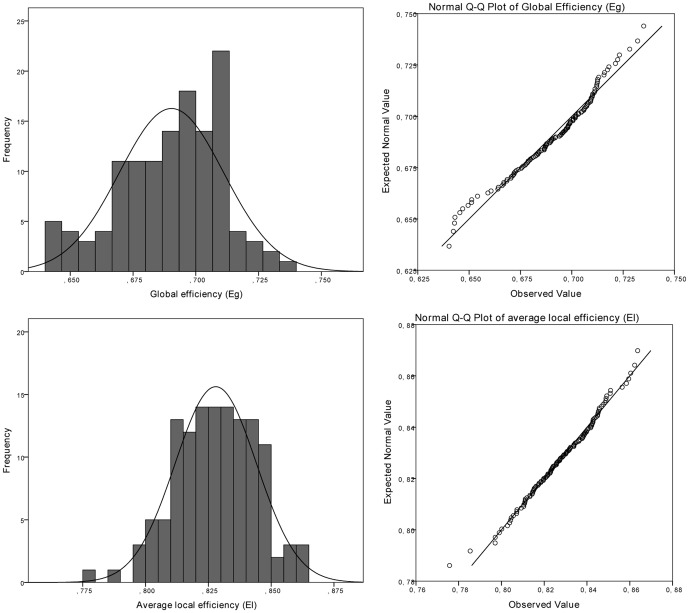
Figure 3. Distribution of global functional network properties.
Global efficiency (Eg) and average local efficiency (El). Data are depicted as histograms (left panels) and Q-Q (quantile-quantile) probability plots (right panels) in which reference lines of the normal distribution are given (n = 127).

