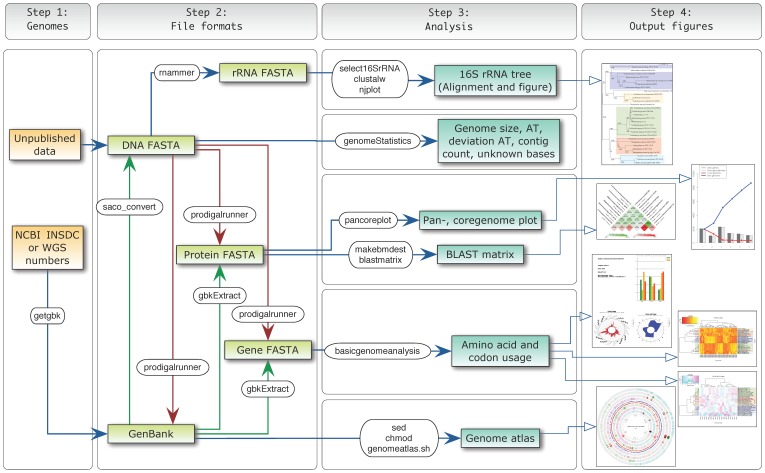
Figure 1. Analysis workflow.
Visual representation of the data flow through each of the steps in the CMG-biotools system. The figure shows the analysis input and program name along with the analysis output type. Green arrows indicate data extraction from a GenBank file format, this data needs to be available in the file for these steps to work. Red arrows indicate local genefinding which results in gene FASTA, protein FASTA and GenBank files.

