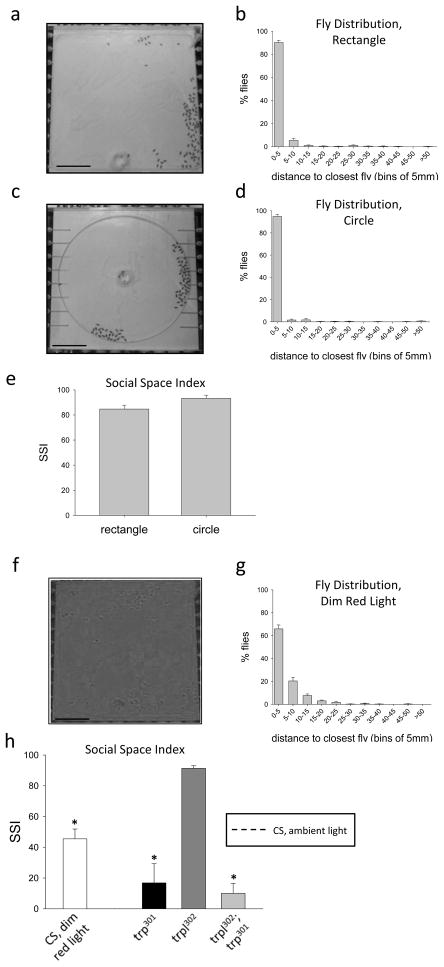
Figure 1. Resource-independent local enhancement of flies in different chambers or under conditions of visual impairment.
a, b. Wild-type Canton-S (CS) males in humidified air in rectangular arena. A representative image is shown (a). Scale bar represents 30 mm. The histogram (b) represents the mean percentage of flies (± SEM) at the indicated distance from their nearest neighbors (n=9). c, d. CS males in humidified air in circular arena. A representative image is shown (c). Scale bar represents 30 mm. The histogram (d) represents the mean percentage of flies (± SEM) at the indicated distance from their nearest neighbors (n=8). e. Social space indices (SSI) for CS flies in the two different chambers shown in a and c (error bars represent ± SEM; no significant difference, Student’s t-test). f, g. A representative image of CS males tested in humidified air in dim red light (f). Scale bar represents 30 mm. The histogram (g) shows the percentage of flies at given distance intervals from their nearest neighbor (mean ± SEM, n=7). h. Summarized mean SSI (± SEM) data for CS flies tested in dim red light (white bar) and for the three visual mutants tested in ambient light: trp301 (n=6), trpl302 (n=5), and trpl302;trp301 double mutants (n=6). The dashed horizontal line represents the mean SSI of CS flies tested in ambient light and is shown for comparison. *p <0.05 compared to CS control.

