
Figure 1.
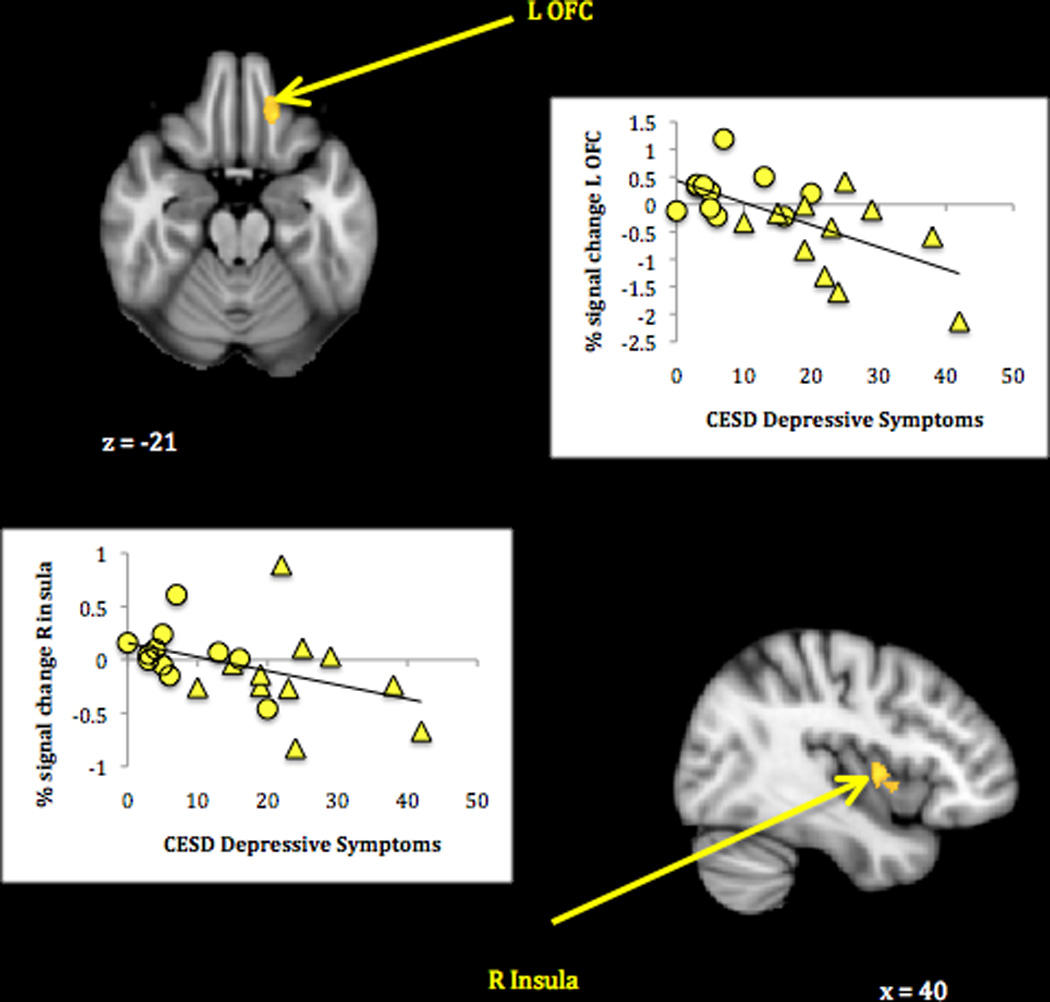
Maternal neural response to own infant compared to other infant joy faces related to lower depressive symptoms.
Note. Activations thresholded at whole-brain FDR = .05 with voxel-level threshold of Z = 2.6, p < .005. Scatterplots show BOLD signal change (compared to rest) associated with own infant joy faces in relation to mothers’ self-reported depressive symptoms. Circles represent non-depressed group mothers; triangles represent depressed group mothers.