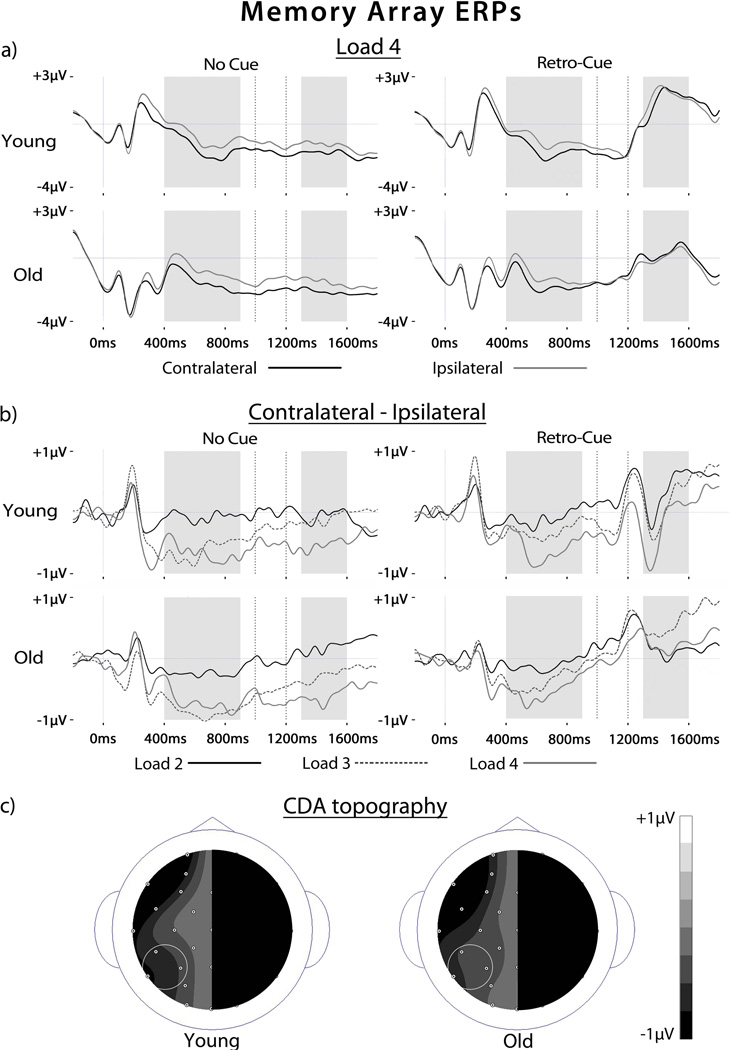
Figure 2.
ERPs to memory arrays. (A) ERPs are shown for no cue and retro-cue targets over contralateral and ipsilateral scalp sites averaged across 3 posterior electrode locations for set size 4 for each age group. The greater negative magnitude for contralateral than ipsilateral targets represents the contralateral delay activity (CDA). Gray shading indicates the time windows for CDA analysis. Dotted vertical lines indicate the retro-cue presentation period. (B) Difference waves representing the CDA for set sizes 2, 3 and 4 for no cue and retro-cue targets for each age group. Gray shading indicates the time windows for CDA analysis. Dotted vertical lines indicate the retro-cue presentation period. (C) Scalp topographies of the CDA collapsed across load and cue type are shown for each age group. Only one side of the scalp is shown as the CDA represents activity averaged across hemispheres. Small circles represent electrode locations as viewed from above. The circled locations indicate the electrodes chosen for CDA analysis (CP5/CP6; P3/P4; P7/P8).

