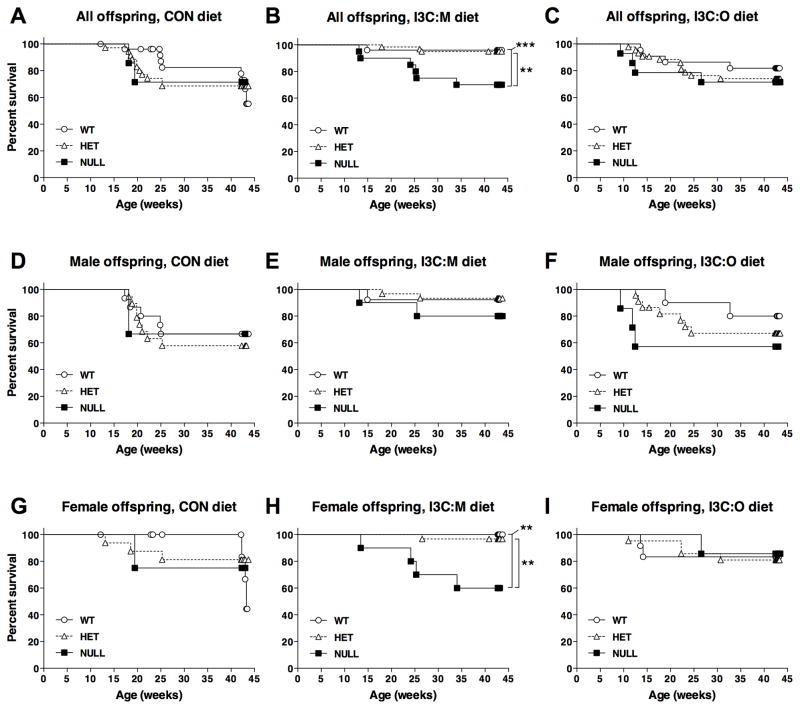
Figure 2.
Impact of Esr2 genotype on T-ALL dependent mortality in offspring initiated with DBC in utero within each experimental diet group. A–C, Survival curves for all offspring (A–C), male offspring (D–F) or female offspring (G–I) within each diet group: control (A, D, G), I3C:M (B,E,H) or I3C:O (C,F,I). Data are stratified according to Esr2 genotype: wild-type (○), heterozygous (△) and null (■). * P <0.05; ** P < 0.01; *** P < 0.001, significant difference in survival for the indicated pairwise comparisons as determined by Lifetables (Kaplan Meir method) analysis. Complete statistical results for these analyses (as well as results of similar analyses for mortality due to any cause, such as anemia or other cancers) are provided in Supplementary Table S1.

