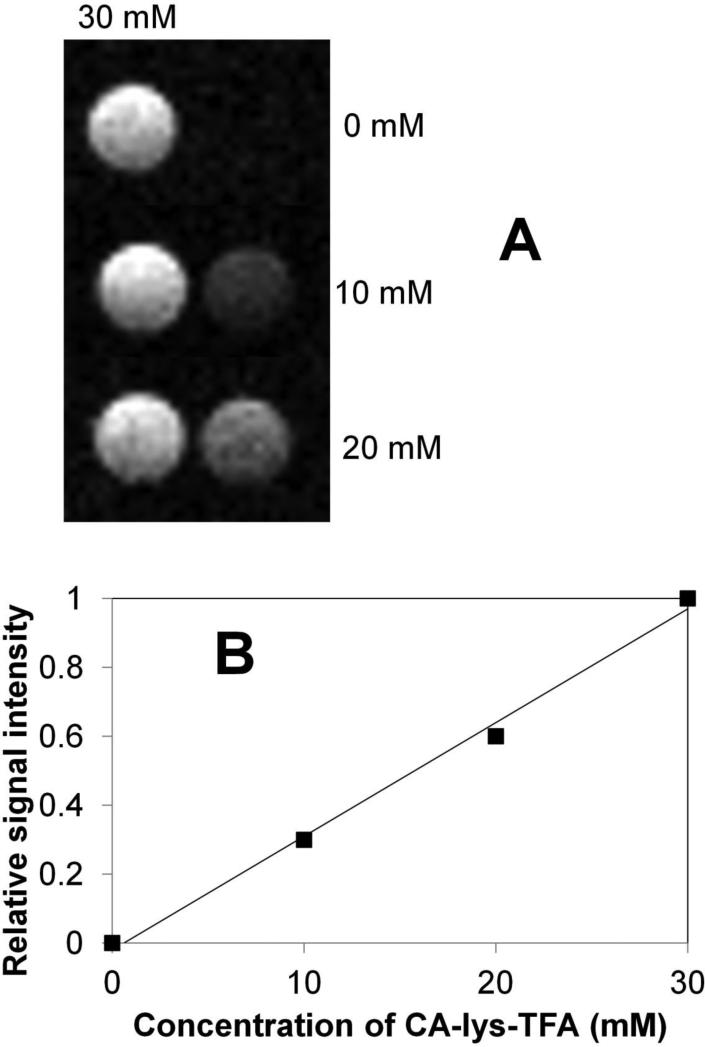
Figure 6.
In vitro 19F MRI images of 0, 10, and 20 mM CA-lys-TFA alongside a 30 mM CA-lys-TFA vial for each sample (panel A) and their corresponding signal intensities relative to the 30-mM vial (panel B). Signal intensities were found to linearly correspond to concentration. The line was obtained from linear regression.

