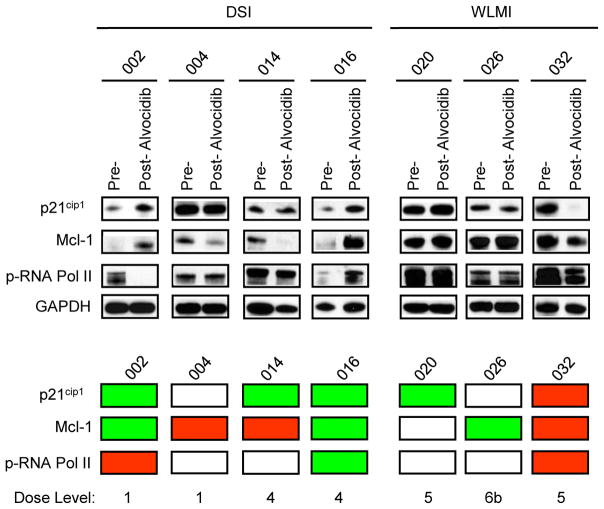
Figure 1.
Western blot analysis of protein expression of p21CIP1, Mcl-1, and p-RNA Pol II in bone marrow samples containing ≥ 59% blasts obtained from patients, before and 24 h after alvocidib treatment. Patient samples are divided into 2 groups according to the 2 alvocidib infusion schemes (DSI and WLMI) employed in this study. GAPDH is used as an internal loading control. The panel below provides a color scheme comparing results for the pre-treatment sample to results for the post-treatment sample. Red = down-regulation, green = up-regulation, and white = no change.

