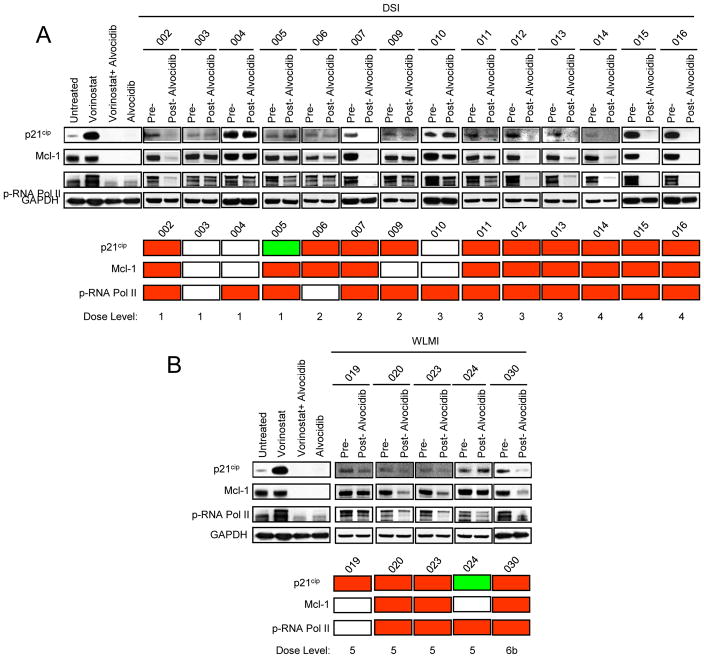
Figure 2.
Analysis of expression of p21CIP1, Mcl-1, and p-RNA Pol II in U937 cells treated with 1-μM vorinostat in the presence of 90% patient human plasma collected before and 24 h after alvocidib treatment. Samples are divided into 2 groups according to the 2 alvocidib infusion schemes used in this study i.e., (A) DSI and (B) WLMI. As a control, results of an in vitro experiment with U937 cells treated (24 h) with vorinostat (1 μM) and/or alvocidib (150 nM) are also shown. GAPDH is used as an internal loading control. The panel below represents a color scheme comparing results for the pre-treatment sample to results for the post-treatment sample. Red = down-regulation, green = up-regulation, and white = no change.

