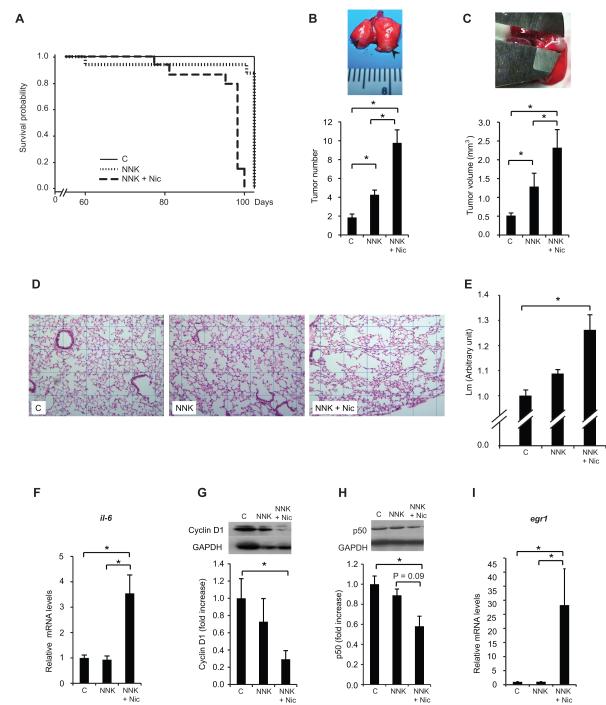
Figure 2. Nicotine decreases survival probability, lung tumor multiplicity and size, and emphysema development.
The survival curves for the three treatment groups in Experiment 1 were analyzed using the SAS® PROC LIFETEST. The results of the log-rank test for the control, NNK, and NNK + Nic groups (p < 0.01) are shown in (A). The quantification of the lung tumor multiplicity is shown in (B). Inset: lung surface tumors (arrows). The number of lung surface tumors and the quantification of the lung tumor volume (mm3) are shown in (C). Inset: the measurement of the lung tumor diameter with a caliper. Representative images of the hematoxylin and eosin (H&E)-stained slides (grid: 0.5 × 0.5 μ-pixels) are shown in (D).The degree of emphysema was quantified by calculating the mean linear intercept (Lm) using 10 fields per animal (E). The lung il-6 mRNA levels are shown in (F). The lung cyclin D1 protein levels are shown in (G). Inset: a representative image of the cyclin D1 and GAPDH proteins. The lung p50 protein levels are shown in (H). Inset: a representative image of the p50 and GAPDH proteins. The lung egr1 mRNA levels are shown in (I). The proteins were detected using Western blotting. The intensity of the bands was quantified densitometry and was normalized to GAPDH. The mRNA levels were measured by qRT-PCR and normalized to β-actin mRNA levels. The columns represent the mean ± sem. *p < 0.05. Abbreviations: C: control; Nic: nicotine; NNK: 4-(methylnitrosamino)-1-(3-pyridyl)-1-butanone; il-6: interleukin-6; egr1: early growth response 1.

