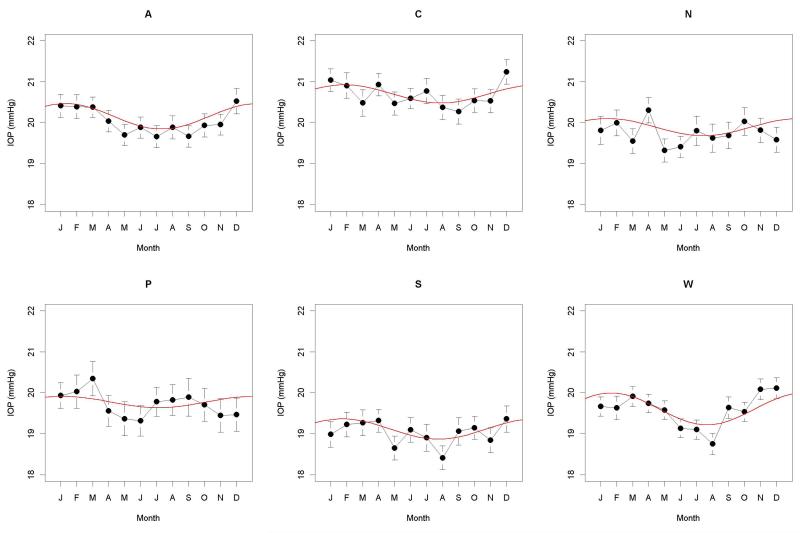
Figure 2.
Intraocular Pressure (IOP) measured during each month (January, February, March, April, May, June, July, August, September, October, November, December), for each of the six geographical zones (Atlantic, Central, North, Pacific Northwest, Southeast, and West). For each month, the black circle represents the mean, with vertical lines extending to the 95% confidence interval for the mean. If a significant seasonal effect was found in that zone, it is shown by a red line.

