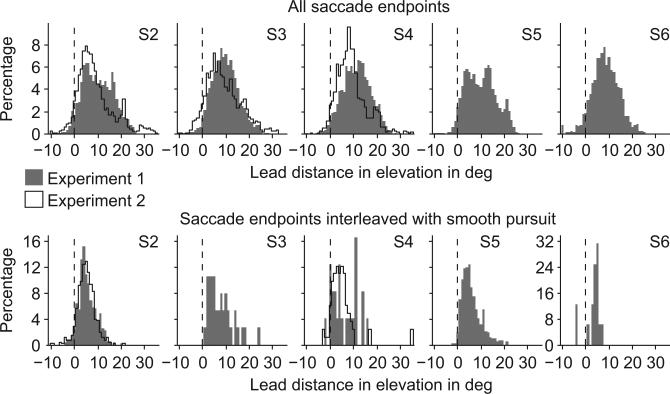
Figure 4.
Saccade endpoints are ahead of cursor location. Histograms of lead distances in the elevation direction for S2–S6 in experiment 1 (gray bars) and for S2–S4 in experiment 2 (black line). For each saccade, the lead distance was calculated as the elevation of gaze position minus the elevation of cursor position at the end of a saccade. Data for left and right cursors were pooled. The dashed lines mark the lead distance of 0 deg. The top row shows data for all saccade endpoints. The bottom row shows data for saccade endpoints for saccades that were interleaved with smooth pursuit eye movements. S3 did not show saccades interleaved with smooth pursuit in experiment 2.

