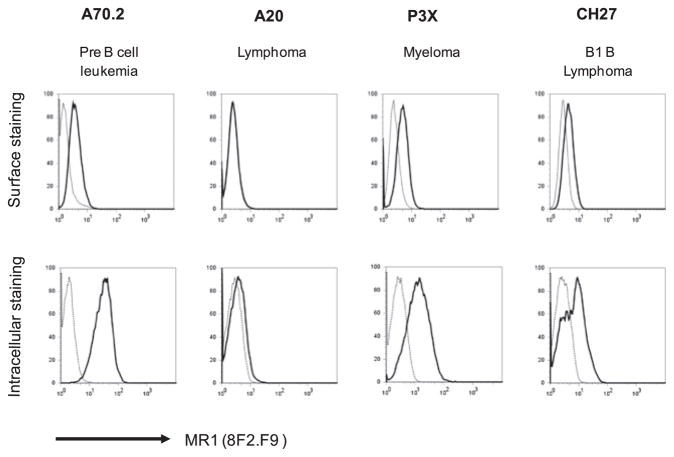
FIGURE 1.
B cells express a low level of endogenous MR1 at the cell surface. Different B cell lineages were stained by anti-MR1 mAb 8F2.F9 and analyzed by flow cytometry. Surface staining (upper panels) of endogenous MR1 is low, whereas intracellular (total) staining (lower panels) of endogenous MR1 is abundant in pre B, myeloma, and B1 B cell lines. By contrast, the A20 cell line does not express endogenous MR1. In the graphs (representing one of five independent experiments), the solid line indicates MR1 staining and the dotted line indicates the background of PE–anti-mouse IgG1 secondary Ab.

