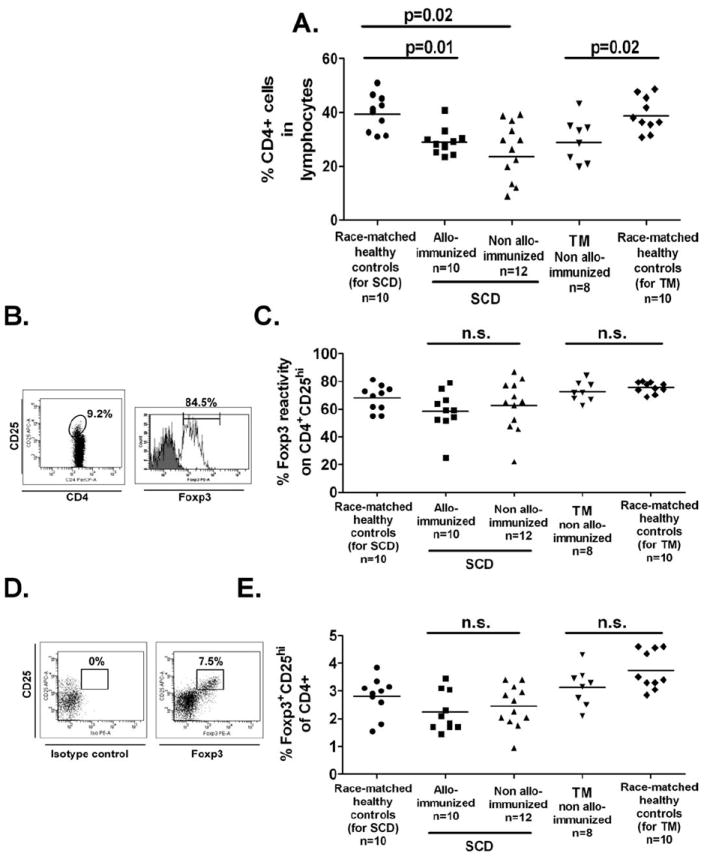
Figure 1.

Phenotypic analysis of Treg compartment in chronically transfused SCD and TM patients. (A) For Treg enumeration, CD4+ lymphocyte population in peripheral blood was analyzed by flow cytometry and are shown for transfused SCD patients with (squares, n = 12) or without (triangles, n = 10) alloantibodies, and transfused non-alloimmunized TM patients (upside-down triangles, n = 8). Race-matched African American and Hispanic (circles, n = 10 for SCD), and Caucasian and Asian (diamonds, n = 10 for TM) volunteers constituted the healthy control groups. Statistically significant differences between groups are indicated by P values. (B) Foxp3 expression levels with respect to the antibody isotype control in the CD4+CD25hi cell population as defined by the gating strategy were measured and (C) are shown for each of the patient and control groups. Similarly, (D) frequencies of Foxp3+CD25hi of the CD4+ T-cell population were analyzed based on the Foxp3 isotype control and (E) are shown for patient and control groups. Differences between groups were not statistically significant (“n.s.”).
