
Figure 3. Similarities in gene expression changes and relationship between different classes of PBMC samples.
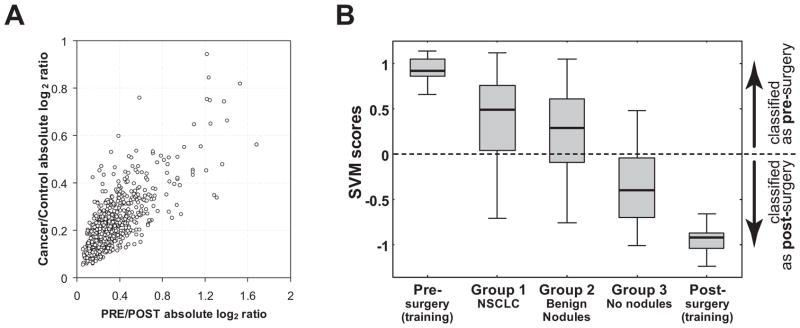
A. Correlation of expression ratios (log2 values) for 751 genes identified both in the comparison of NSCLC to non-malignant control patients (y-axis) and the pre- vs. post-surgery lung cancer patients (x-axis). This similarity in differential gene expression in both studies suggests information that distinguishes malignant and benign nodules in the previous study is also present in the pre vs. post surgery data.
B. Relationships between cancer and control sample classes. Classification (SVM) scores of various sample groups based on 50 genes (Figure 1) that were differentially expressed in pre- vs. post-surgery PBMC from NSCLC patients. Whisker ends show full range of scores for each group; grey boxes include 50% range; horizontal line within each indicates median score. Number of samples in each class (from left to right) is 18, 127, 41, 50 and 18.