Figure 1.
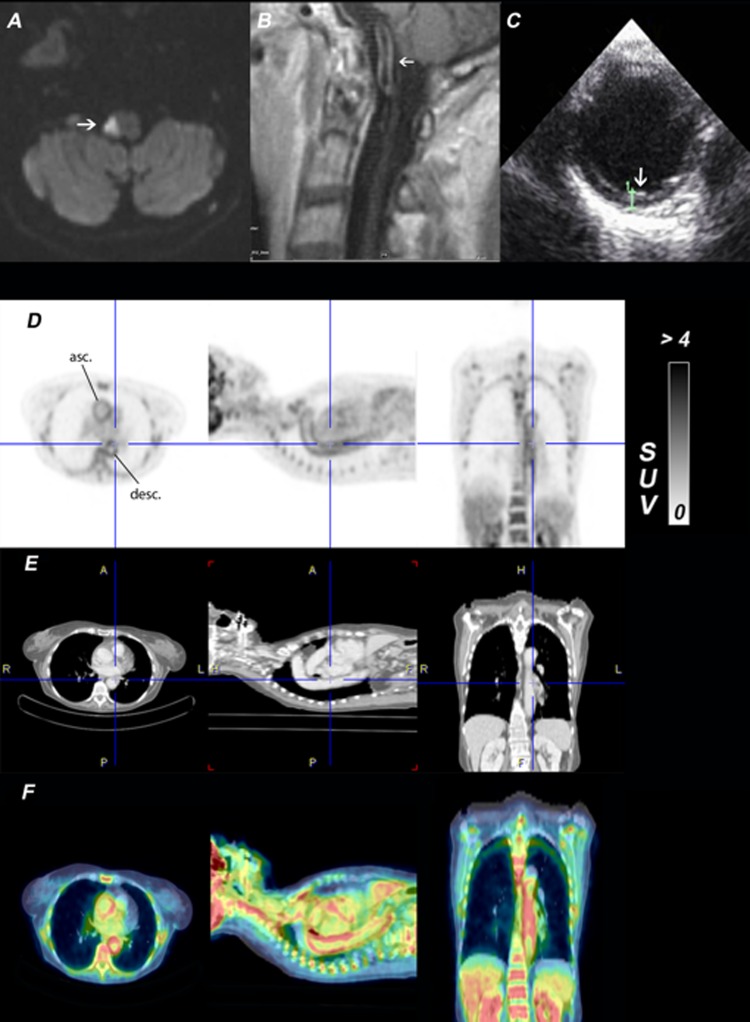
(A) 1.5 tesla MRI, diffusion weighted imaging shows diffusion restriction in the right dorsolateral medulla oblongata (white arrow). (B) 1.5 tesla MRI, T1 postcontrast agent shows vessel-wall enhancement and thickening of the basilar artery (white arrow). (C) Transoesophageal ultrasound shows the thoracic aorta with a wall thickening of 2.9 mm (white arrow). (D) Three orthogonal slices of the 18F-FDG whole-body PET. The colour table is scaled to the range 0–4 of the standardised uptake value. There is a significantly increased uptake of 18F-FDG in the wall of the thoracic aorta (asc., ascending; desc., descending aorta). (E) Coregistered body CT imaging. (F) PET/CT fusion images.

