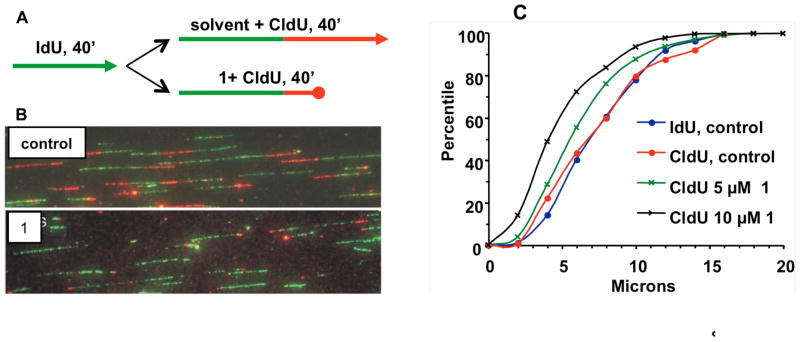
Figure 10.

Microfluidic-assisted replication tract analysis (ma-RTA) of A172 glioma cells without and with 40 min exposure to 5 and 10 μM 1: (A) experimental design; (B) images of micro track capillaries; (C) percentile analysis of track length (μm) from B. The Kolmogorov–Smirnov (K–S) test was performed to determine P-values of different cumulative distributions.
