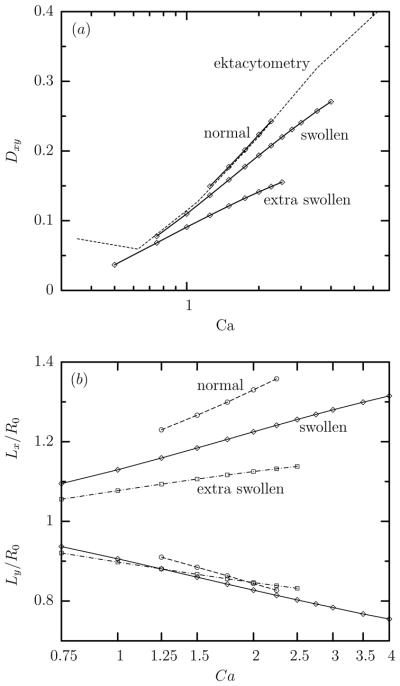
FIG. 4.

(a) The average value at steady state of the ektacytometry deformation Dxy versus the capillary number Ca for normal, swollen and extra swollen erythrocytes in a linear-log plot for viscosity ratio λ = 0.1. (b) As in (a) but for the ektacytometry projection semi-lengths Lx and Ly. Also included in (a) are the experimental findings (dashed lines) reported in figure 3 of Hardeman et al. [18] which have been converted to the capillary number domain using Gs = 2.4 μN/m and μc = 6 mPa s [15, 25].
