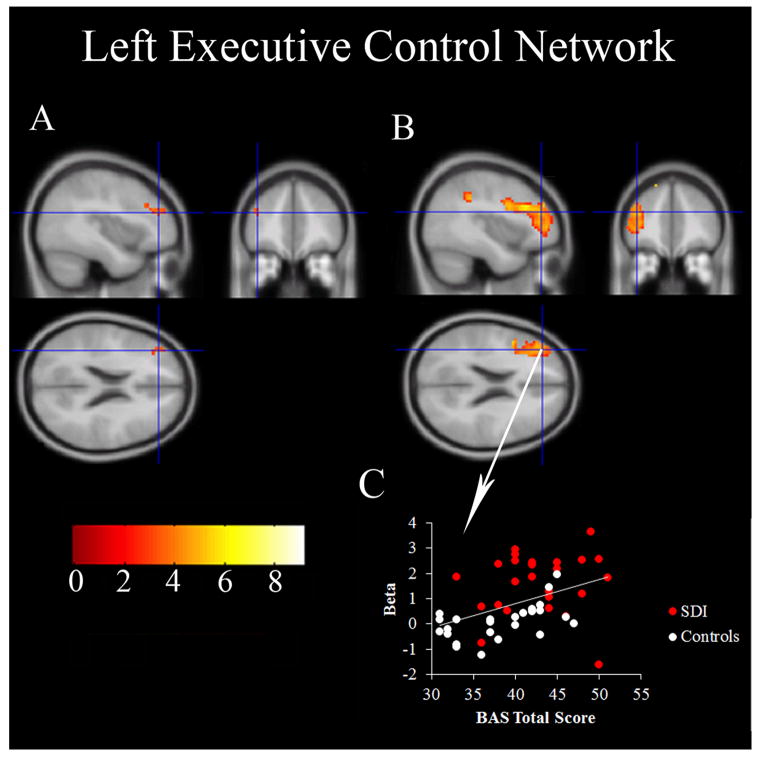
Figure 3.
Part A shows the BAS regression model where the voxels in the left executive control network correlate with total BAS scores. Part B shows the group difference in the left executive control network where SDI had greater activity than controls. The crosshairs show the same location on both parts A and B. Part C shows the correlation (r=0.43, p=0.002) between activation and the total BAS scores at the point of the crosshairs (MNI −39, 41, 22). This figure is presented in neurologic view (right is right, left is left).

