
Fig. 3.
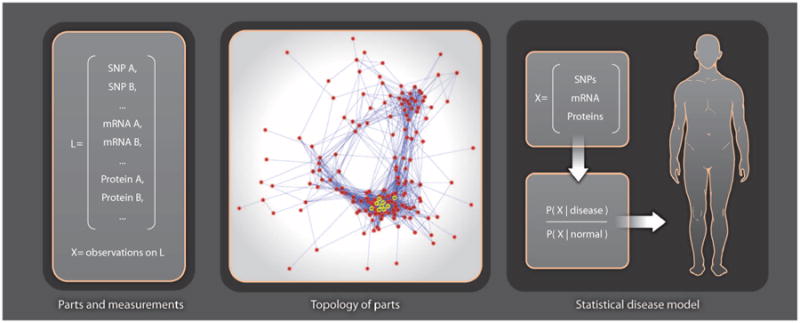
Statistical learning of molecular networks and disease phenotypes. The panel on the left shows the names of a set L of measured molecular species, where X represents the observed states [for singlen-ucleotide polymorphisms (SNPs) ] or concentrations (for mRNAs and proteins) for an individual. A topology of parts (molecular network) is then constructed, where nodes are the measured species L and edges represent molecular interactions. The rightmost panel shows how a statistical model of disease, expressed as the likelihood of the measurements X, in disease divided by likelihood in normal, is used to make a personalized diagnosis. Building this classifier for diagnosing the individual requires knowing the likely and unlikely states that distinguish health from disease.