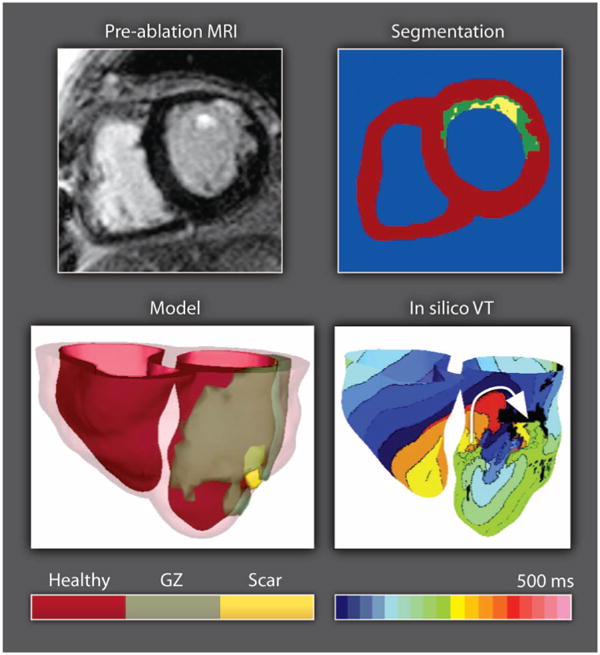
Fig. 4.

Modeling electrical activity in the infarcted heart. Clinical MR scan of an infarcted patient heart before ablation (treatment) and the corresponding segmentation: healthy (red), gray zone (GZ) of functional but impaired tissue surrounding the scar (green), or scar (yellow). A three-dimensional geometric model of the patient heart was rendered with the epicardium and the infarct border zone semitransparent. An in silico activation map of VT reveals reentry on the left ventricular endocardium. The color code in the bottom right shows electrical activation time.
