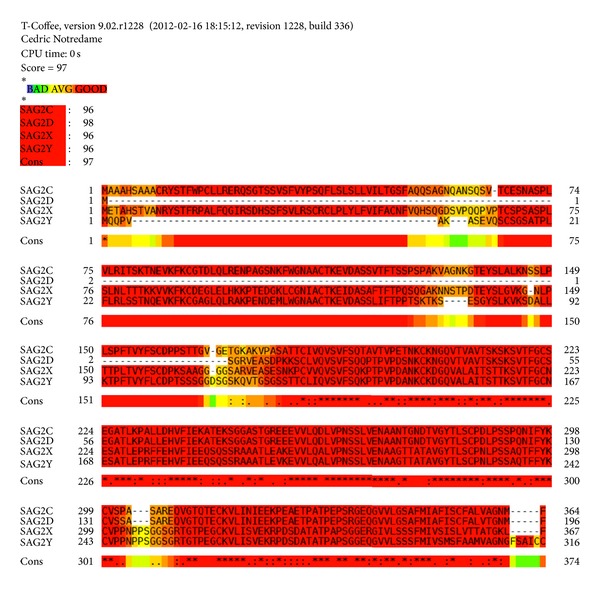
Figure 1.

Alignment analysis for SAG2C, -2D, -2X, -2Y proteins. T-Coffee: multiple sequence alignment tools were used to obtain the alignment analysis result for SAG2C, -2D, -2X, and -2Y. Color bar indicated the identity, from bad identity to good identity.
