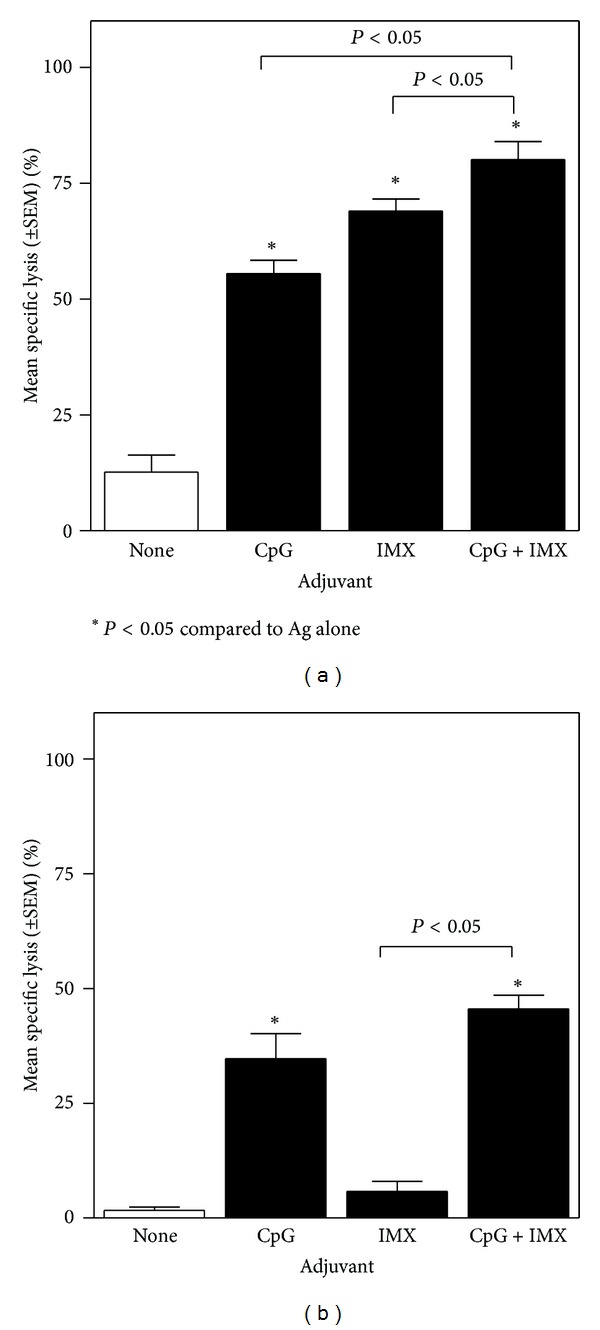
Figure 4.

(a) BALB/c mice (n = 10/group) were immunized on days 0 and 28 by IM injection of 1 μg HBsAg either alone (none) or combined with CpG (10 μg), ISCOMATRIX (IMX) (1 μg), or CpG (10 μg) + ISCOMATRIX (1 μg). Spleens were removed 4 wks after second immunization and CTL activity was determined. Bars represent the HBsAg-specific lysis as a percentage of the total possible lysis (% specific lysis) at an effector : target ratio of 50 : 1. (b) C57Bl/6 mice (n = 10/group) were immunized on days 0, 14, and 21 by IM injection of 10 μg OVA either alone (none), or combined with CpG (10 μg), ISCOMATRIX (1 μg), or CpG (10 μg) + ISCOMATRIX (1 μg). Spleens were removed 1 wk after final immunization and CTL activity was determined. Bars represent the OVA-specific lysis as a percentage of the total possible lysis (% specific lysis) at an effector : target ratio of 50 : 1. The percent lysis was calculated as [(experimental release − spontaneous release)/(total release − spontaneous release)] × 100. Spontaneous release was determined by incubating target cells without effector cells, and total release was determined by adding 100 μL of 2 N HCl to the target cells. The percent specific lysis was calculated as follows: % lysis with Ag-expressing cells − % lysis with control cells. Representative data from one of five independent experiments is shown in each graph.
