
Figure 5.
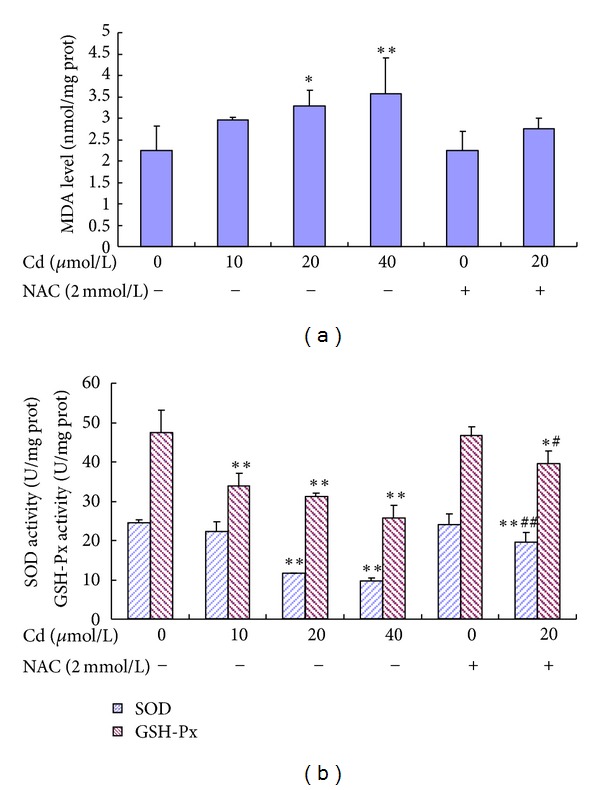
Effect of Cd and NAC on MDA level (A), SOD activity, and GSH-Px activity (B) in BRL 3A cells. Cells were treated with 0 μmol/L to 40 μmol/L Cd and pre-treated with or without 2 mmol/L NAC for 12 h. Data are presented as mean ± SD of three independent experiments performed in triplicate. Significant difference: *P < 0.05, **P < 0.01, compared with the control. # P < 0.05, ## P < 0.01, compared with the 20 μmol/L Cd group.