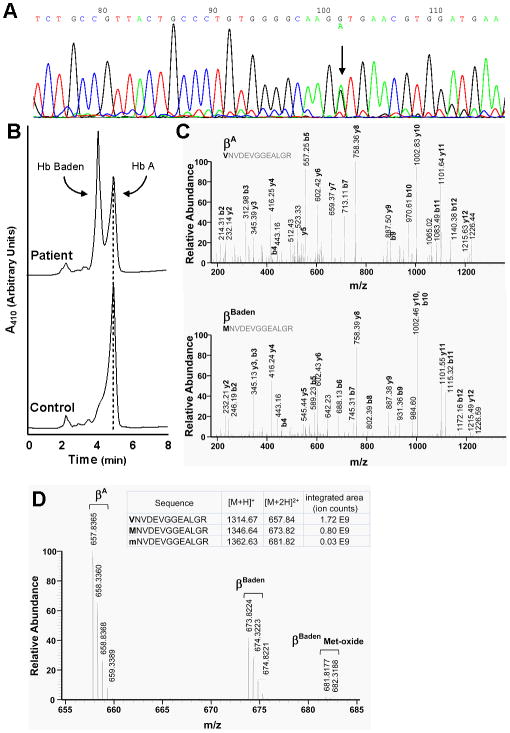
Figure 1. Identification of Hb Baden.
(A) Genomic sequencing. PCR-amplified β-globin genes were subjected to automated sequencing using site-specific DNA primers. The normal β-globin gene sequence is illustrated. An arrow indicates the position of the G→A transition that defines βBaden. (B) HPLC analysis of clarified hemolysate. Patient (top) and normal control samples (bottom) are illustrated. Positions of Hb A and Hb Baden are indicated. (C) Mass spectrometric analyses of wild-type and variant globins. Assigned MS/MS spectra of T-3 tryptic peptides from βA(top) and βBaden(bottom). Masses of corresponding b-ions (which retain the N-terminal β18 amino-acid) differ by 32 Da, while masses of corresponding y-ions (which delete the amino-acid at this position) are identical. (D) Full-scale mass spectrum. The m/z values for βA, βBaden, and βBaden-oxidized Met are illustrated.

